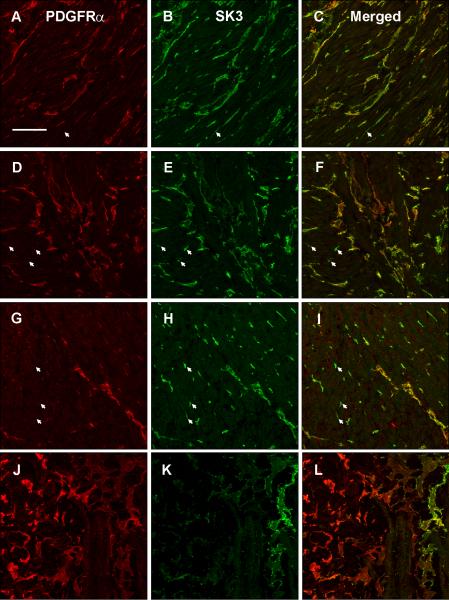
Figure 2.
PDGFRα immunoreactivity in longitudinal muscle (A), myenteric plexus region (D), circular muscle (G) and submucosal plexus (J). SK3 immunoreactivity in longitudinal muscle (B), myenteric plexus region (E), circular muscle (H) and submucosal plexus (K). Overlap between PDGFRα and SK3 immunoreactivity is shown in panel C for longitudinal muscle, panel F for the myenteric plexus region, panel I for circular muscle and panel L for the submucosal plexus. Arrows represent SK3-ir cells that are not PDGFRα-ir. Tissue obtained from the normal gastric body of a human subject. Scale = 100 μm

