
Figure 2.
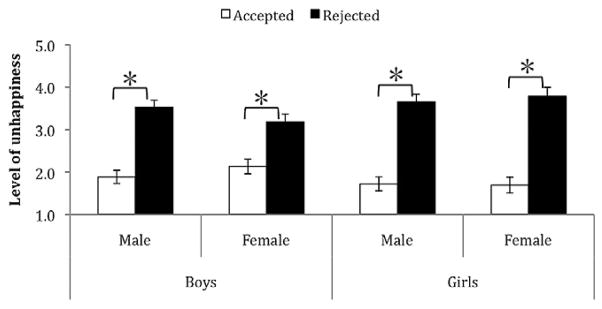
Ratings of Unhappiness in Response to Peer Acceptance or Rejection During the Playdate Task.
Notes. Data are presented separately for boy and girl participants as they responded to male and female potential (pictured) peers. Error bars represent standard errors of the mean. * p < .05.