
Figure 1.
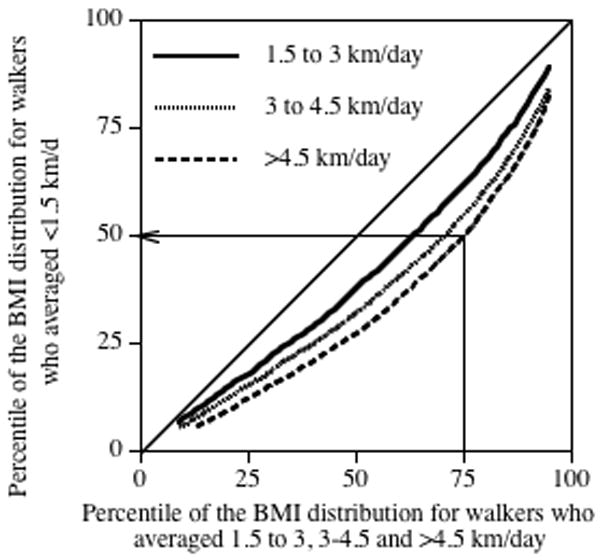
Quantile-Quantile (Q-Q) plot comparing the BMI distributions of the female walkers who averaged 1.5–3.0, 3.0–4.5, and ≥4.5 km/d with those who averaged <1.5 km/day. For example, the arrow shows that the 75th percentile of the most active female walkers corresponds to only the 50th percentile of the least active female walkers. Data adjusted for age, education, and alcohol intake.