
Figure 5.
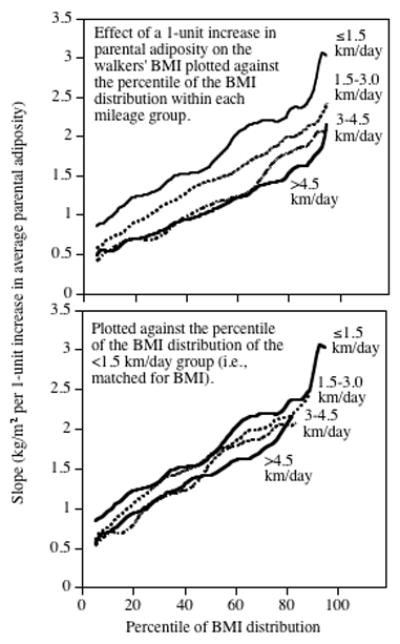
Upper panel: Graphs of the regressions slope between parental adiposity index (independent variable) and the womens’ BMI (dependent variable) at different percentiles of the BMI distribution, for women who walked <1.5, 1.5–3, 3–4.5, and >4.5 km/day. Lower panel: The same graphs re-plotted to correspond to the same BMIs using the quantile-quantile plot of Figure 1.