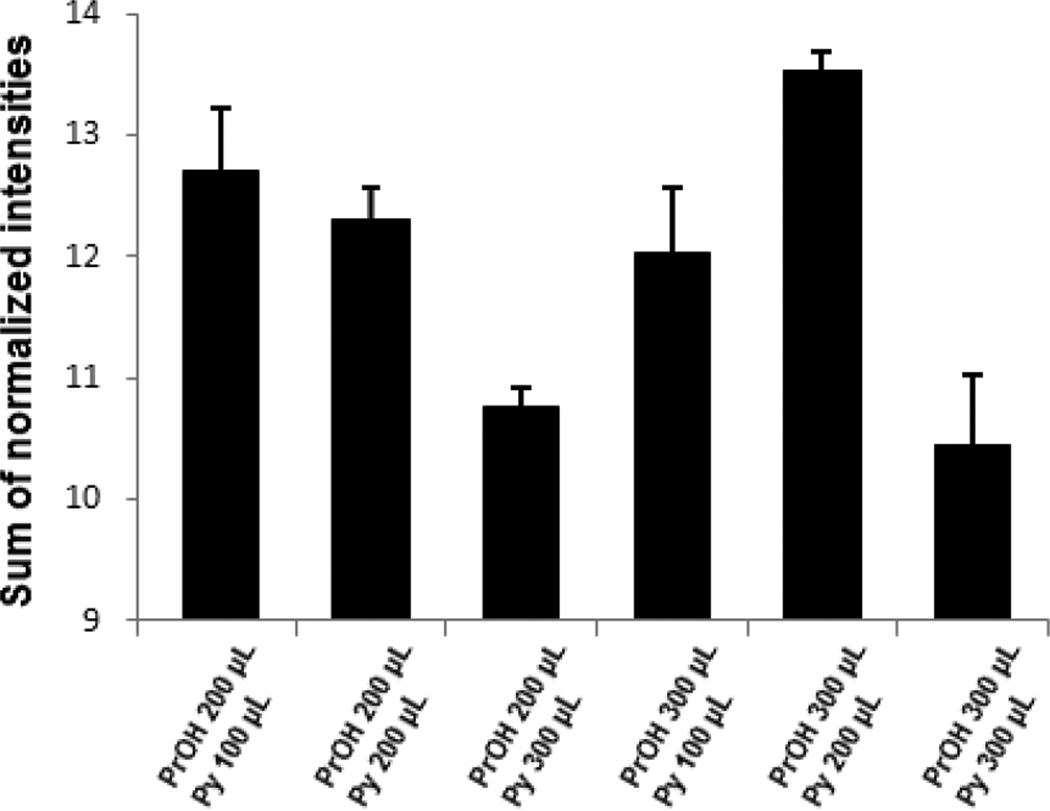
Fig. 3.
Optimization of the derivatization solvents, propanol (PrOH) and pyridine (Py). The bar plots show total intensities (sum) of normalized intensity of each metabolite, which was normalized to the average intensity across the six methods. Error bars indicate the standard error of triplicate samples.

