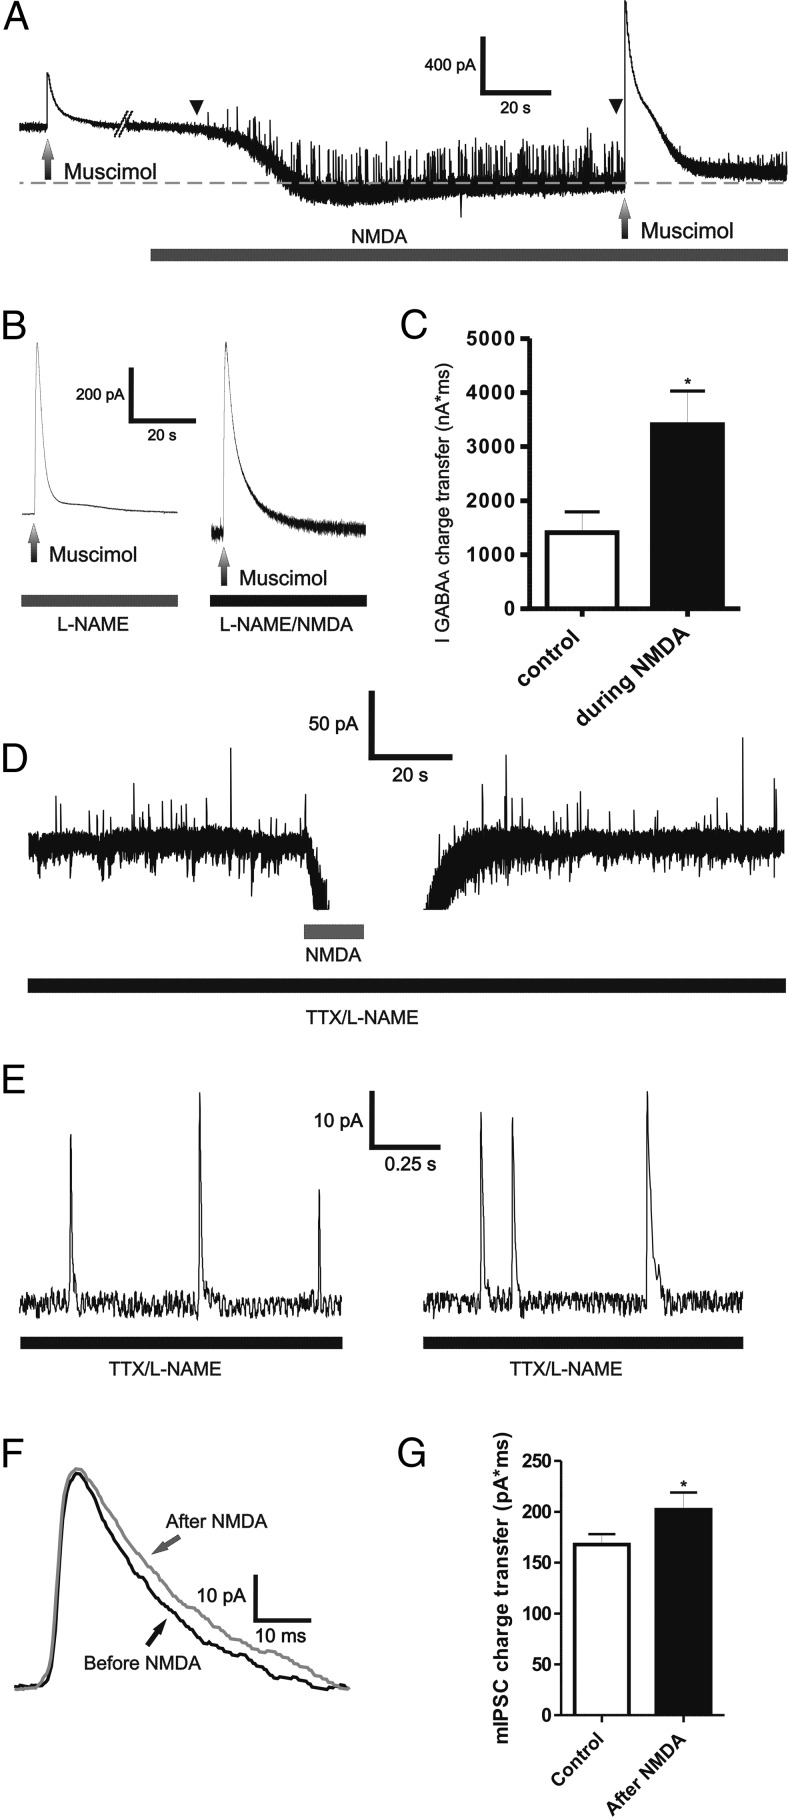
Figure 4.
NMDAR activation enhanced muscimol and synaptically mediated IGABAA in a NO-independent manner. A, Representative example depicting an increased in the frequency of outward IPSCs (between arrowheads) during bath application of 30 μm NMDA. B, Representative example of a muscimol-evoked IGABAA before and during bath application of 30 μm NMDA in the presence of the NO synthase blocker l-NAME (1 mm). C, Summary data showing the mean IGABAA magnitude before and during NMDA application in the presence of l-NAME (n = 4). D, Representative example depicting outward mIPSCs (arrows), before and after focal application of NMDA (30 μm, 5 s). Lower traces show segments of mIPSC for each period, at a more expanded time scale. E, The averaged mIPSC corresponding to the periods before and after NMDA application for the MNC shown in D are depicted. F, Representative example of the averaged mIPSC before and after NMDA application. G, Summary data showing mean mIPSC charge transfer before and after NMDA puff in the presence of TTX and l-NAME (n = 6). *p < 0.05 versus respective controls. All recordings were obtained from sham rats.

