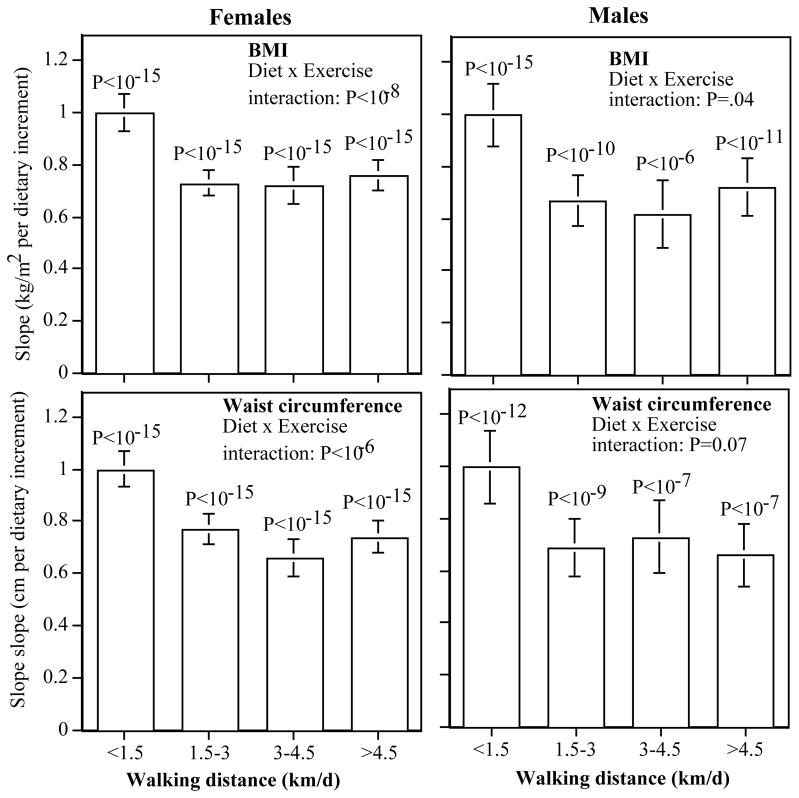
Figure 1.
Bar chart of the regression slopes for BMI and waist circumference vs. the high-risk diet index for different walking distances. Significance levels above the bars represent the significant of the slope within the distance interval. The significance of the diet x exercise interaction tests whether the BMI or waist circumference increase per unit increase in diet differs by walking distance.

