Abstract
Various confocal microscope architectures have been developed for in vivo tissue imaging, including single-axis confocal (SAC) and dual-axis confocal (DAC) configurations utilizing both point-scanning (PS) and line-scanning (LS) approaches. While it is known that these design variations lead to tradeoffs in imaging performance, a quantitative comparison of the imaging performance of these configurations in highly turbid media would be of value. Here, we perform Monte-Carlo simulations to evaluate the optical-sectioning capability of these various confocal microscope architectures in reflectance mode. In particular, we investigate the axial and transverse responses of these configurations to reflective targets at various depths within a homogenous scattering medium. We find that the DAC-PS configuration results in superior rejection of multiply scattered background light compared to all other configurations, followed in performance by the SAC-PS, the DAC-LS, and then the SAC-LS. Line scanning with both the DAC and SAC configurations leads to photon crosstalk between pixels. However, at shallow depths, the axial and transverse resolution of all configurations is maintained in a homogeneous scattering medium.
Confocal microscopy is a popular imaging technique because of its optical sectioning capability. In its most basic form, point illumination and pinhole detection allows for the rejection of out-of-focus and multiply scattered light from thick scattering objects, providing improved resolution and contrast for imaging within cells and tissues [1]. Various confocal microscope designs have been developed for a range of applications, resulting in unique tradeoffs in imaging performance. These variations include the dual-axis confocal (DAC) and single-axis confocal (SAC) architectures operating in both point-scanning (PS) and line-scanning (LS) modes [2–5]. In the past, these imaging devices have been characterized for spatial resolution and optical-sectioning ability in non-scattering media [6]. Quantitative analyses of sectioning ability in scattering media have also been made for individual configurations, both experimentally and numerically [2, 7]. However, a direct quantitative comparison between various configurations is of value for evaluating the relative strengths and weaknesses of each imaging approach [8]. Therefore, we have performed Monte-Carlo simulations to assess the imaging performance of both point-scanned and line-scanned DAC and SAC microscopes in a homogenous scattering medium.
All Monte-Carlo simulations were carried out in FRED software (Photon Engineering). This software performs Monte-Carlo ray tracing based on a Henyey-Greenstein approximation of Mie scattering theory, as detailed previously [9]. For our simulations, we assume a scattering coefficient, μs, of 30 mm−1 and an anisotropy factor, g, of 0.81. These values lie within the conditions that have been reported for human skin at a wavelength of 633 nm [10]. Since μs and g fully define the scattering properties within tissue for our Monte-Carlo simulations, we set the index of refraction of the scattering media, n, as unity for simplicity and to preclude aberrations and Fresnel reflections at the air-tissue interface. Note also that our Monte-Carlo simulations do not account for diffraction (the wave nature of light), absorption, and polarization, nor do they fully capture the complex scattering processes events in real tissues, including refractive effects from structures much larger than the wavelength of light. Nonetheless, they provide a first-order approximation of tissue scattering with which to compare various confocal architectures.
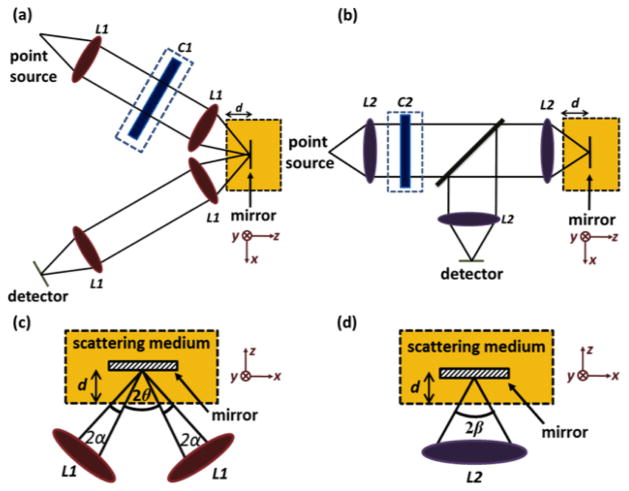
The geometric models used for simulation are presented in Fig. 1. In the DAC setup, two off-axis Gaussian beams are aligned such that the illumination and collection beams intersect at their focus with a crossing half angle, θ, of 30 degrees [2]. Note that a Gaussian radial distribution is simulated for all beams, but that diffraction is not modeled in the Monte-Carlo simulations. Each individual beam has a 1/e2 focusing half angle, α, of 0.11 rad and the lens (L1) used in the DAC has a focal length of 25.6 mm. Based on diffraction theory, we have chosen to design the SAC to have the same FWHM (−3 dB) axial resolution (section thickness) as the DAC [11]. As a result, the 1/e2 focusing half angle, β, of the SAC is calculated as 0.42 rad. For the SAC microscope, a custom aspheric lens (L2) with a focal length of 16.8 mm was designed in Zemax (Radiant Zemax, LLC) to produce a diffraction-limited focus and was imported into FRED. In order to generate a focal line for LS configurations, cylindrical lenses (C1 and C2) are added into the DAC and SAC models as shown in Fig. 1. The focal lengths of these cylindrical lenses are chosen to yield a focal line that is roughly 500 μm long extending in the y direction at the imaging plane (focal length for C1 = 300 mm and C2 = 1000 mm) [3]. In our simulations, the detector plane has a grid spacing of 0.5 μm. Since the DAC and SAC architectures utilize beams with different numerical apertures, the diffraction-limited focal spot sizes also differ [11]. Therefore, in each microscope setup, a detector pinhole of an appropriate size is synthesized by binning the pixels at the center of the detector. For the DAC configuration, a 7 × 7 bin of detector pixels, corresponding to a physical pinhole size of 3 × 3 μm, is utilized. This pinhole size is found to provide an optimal signal-to-background ratio (SBR) in our simulations, and is slightly larger than the diffraction-limited spot size of a beam with a 1/e2 NA = 0.11 [11]. For the SAC configuration, a 3 × 3 bin of detector pixels, corresponding to a physical pinhole size of 1 × 1 μm, is chosen. This also yields an optimal SBR in our simulations, and is slightly larger than the diffraction-limited spot size of a beam with a 1/e2 NA = 0.42. Here, we define the 1/e2 NA = n sin(γ), where n is the index of refraction of the medium and γ is the half angle of a focused Gaussian beam measured to the 1/e2 intensity point (γ= α for the DAC and γ= β for the SAC).
Fig. 1.
The DAC (a) and SAC (b) microscope designs used for Monte-Carlo simulations. The focal regions are shown in (c) and (d) for the DAC and SAC, respectively.
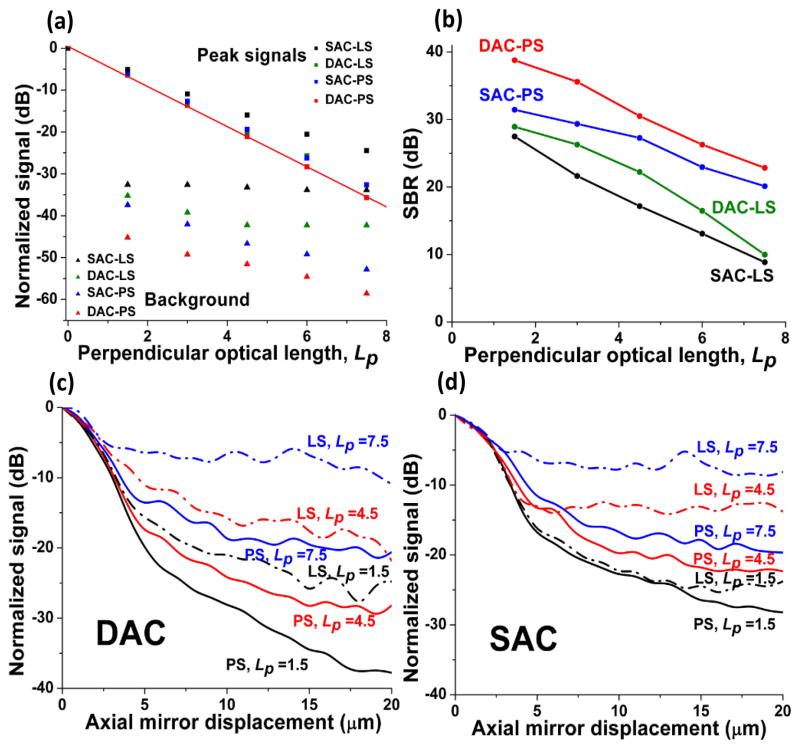
We first simulated the signal obtained by different confocal microscope architectures with a mirror placed at the focal plane. This peak signal, obtained when the mirror is exactly in focus, is dominated by non-scattered (ballistic) photons but contains an increasing amount of background photons at greater depths. Theoretically, this peak signal should decay as an exponential function of imaging depth (at shallow depths) according to the Beer-Lambert Law. Figure 2a confirms that the normalized peak signals, plotted in dB, do obey the Beer-Lambert relation. In Fig. 2a, imaging depth is expressed as a non-dimensional quantity, the “perpendicular optical length,” Lp. This is the total number of mean free paths travelled by ballistic (non-scattered) photons in a perpendicular roundtrip path between the tissue surface and the mirror: Lp = 2μsd. In Fig. 2a, we also plot the background signal that is simulated by removing the mirror from the tissue. The maximum SBR, calculated from the data in Fig. 2a (peak signal divided by background signal), is plotted in Fig. 2b.
Fig. 2.
(a) The simulated peak signal from a mirror at the focus, and the scattering background (no mirror), as a function of optical length (Lp = 2μsd) for all confocal microscope architectures. A linear fit of the DAC-PS peak signal is also shown. (b) The SBR for all configurations. The axial responses of the DAC (c) and SAC (d) configurations with Lp = 1.5, 4.5 and 7.5.
Next, axial mirror scans were simulated at various depths within the homogenous scattering medium. In this case, a flat mirror was translated axially away from the device’s focal plane to determine the axial response of the microscope as a function of imaging depth. The axial responses for all architectures are presented in Figs. 2c and 2d.
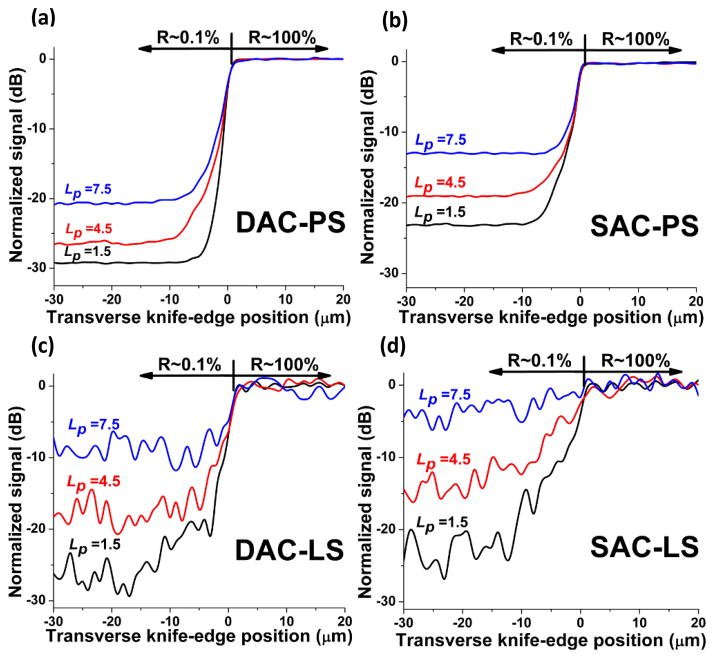
For transverse knife-edge scan simulations, we employed a reflective target consisting of a 0.1% reflective surface adjacent to a 100% reflective surface (30 dB contrast). This knife edge was oriented along the x-axis and placed at the focal plane of the microscopes. For PS configurations, this knife edge was translated in the y direction (see Fig. 1). For LS configurations, this knife edge was kept stationary at y = 0, such that the focal line of the microscopes imaged across the knife edge. The transverse responses are shown in Fig. 3.
Fig. 3.
Transverse responses to a knife-edge reflective target at various imaging depths, Lp =1.5, 4.5, 7.5, for the DAC-PS (a), SAC-PS (b), DAC-LS (c) and SAC-LS (d) architectures.
Simulations indicate that the DAC configuration produces a higher SBR than the SAC configuration when comparing their respective PS and LS modes. Axial-response simulations (Figs. 2c and 2d) show that the DAC microscope has a lower background floor than the SAC microscope through up to Lp = 7.5 within a homogenous scattering medium. These results show good quantitative agreement with previous experimental data, including axial and transverse response measurements in an intralipid scattering phantom [2]. However, this contrast improvement is not as pronounced at greater imaging depths. For instance, in Fig. 2b, the SBR at Lp = 7.5 is not significantly better for the DAC compared to the SAC in both PS and LS modes.
Many investigators have been interested in LS confocal microscopy because of its potential to achieve high-speed imaging with the reduced complexity of only requiring beam scanning in one direction. However, a primary limitation of line-scanning approaches is that the lack of confocality in one dimension results in greater photon crosstalk and diminished rejection of out-of-focus and multiply scattered background light. The simulated transverse response to a knife edge allows us to evaluate this crosstalk. In Fig. 3, we observe that pixel crosstalk results in degraded image contrast in both the DAC-LS (Fig. 3c) and SAC-LS (Fig. 3d) configurations as compared to their respective PS counterparts (Figs. 3a and 3b). This crosstalk also causes the transition length at the knife edge to increase for the LS microscopes. For example, when comparing Fig. 3b and Fig. 3d, it is apparent that the SAC-LS shows a much slower transition in signal at the knife edge compared to the SAC-PS. However, Figs. 3a and 3c show that this crosstalk-induced degradation at the knife edge is less obvious for the DAC. A direct comparison between Figs. 3c and 3d suggests that the DAC architecture is better than the SAC for line scanning, resulting in superior contrast and transverse spatial definition at optical lengths of up to Lp = 7.5. Note that the large signal variability seen in the LS simulations (Figs. 3c and 3d) compared to the PS simulations (Figs. 3a and 3b) is an artifact due to increased statistical noise from spreading out the photon flux over a line rather than a focused spot. Finally, it is worth mentioning that simulations with a knife edge oriented along the y axis, and translated in the x direction, were also performed for the SAC-LS and DAC-LS. The data (not shown) indicates that crosstalk is not an issue in this direction, since it is confocal with the detector slit.
Overall, our simulations reveal that spatial resolution is maintained in all microscope architectures at shallow depths. Here, axial resolution is defined by the FWHM (−3 dB) points and transverse resolution is defined by the 10% to 90% transition width. Note that these simulations are performed with a homogenous scattering medium and that real tissues contain heterogeneities that introduce beam steering and aberrations, resulting in degraded spatial resolution (misalignment) as a function of depth [3].
In summary, we have provided quantitative comparisons between PS and LS versions of the DAC and SAC microscope architectures in reflectance mode. In both PS and LS modes, the DAC is superior to the SAC, especially at shallow imaging depths. In particular, we find that for line scanning, the DAC exhibits less degradation in contrast and spatial definition compared to the SAC. This suggests that the DAC-LS may provide an optimal balance between imaging speed, depth, resolution, contrast, and cost for certain imaging applications. This hypothesis has been explored in previous studies [3] and will be investigated in greater detail by us in the future.
Acknowledgments
We acknowledge research support from the NIBIB - R00 EB008557 (Liu), the NIDCR – R01 DE023497 (Liu), the office of the vice president for research at Stony Brook University, and the Undergraduate Research & Creative Activities (URECA) program at Stony Brook University (support for Y. Chen). We also thank Steven Leigh for paper revisions.
References
- 1.Pawley JB. Handbook of Biological Confocal Microscopy. 2. Plenum; New York: 1995. [Google Scholar]
- 2.Liu JTC, Mandella MJ, Crawford JM, Contag CH, Wang TD, Kino GS. Efficient rejection of scattered light enables deep optical sectioning in turbid media with low-numerical-aperture optics in a dual-axis confocal architecture. Journal of Biomedical Optics. 2008;13:034020. doi: 10.1117/1.2939428. [DOI] [PubMed] [Google Scholar]
- 3.Dwyer PJ, DiMarzio CA, Rajadhyaksha M. Confocal theta line-scanning microscope for imaging human tissues. Applied Optics. 2007;46:1843–1851. doi: 10.1364/ao.46.001843. [DOI] [PubMed] [Google Scholar]
- 4.Sabharwal YS, Rouse AR, Donaldson L, Hopkins MF, Gmitro AF. Slit-scanning confocal microendoscope for high-resolution in vivo imaging. Applied Optics. 1999;38:7133–7144. doi: 10.1364/ao.38.007133. [DOI] [PubMed] [Google Scholar]
- 5.Carlson K, Chidley M, Sung KB, Descour M, Gillenwater A, Follen M, Richards-Kortum R. In vivo fiber-optic confocal reflectance microscope with an injection-molded plastic miniature objective lens. Applied Optics. 2005;44:1792–1797. doi: 10.1364/ao.44.001792. [DOI] [PubMed] [Google Scholar]
- 6.Patel YG, Rajadhyaksha M, Dimarzio CA. Optimization of pupil design for point-scanning and line-scanning confocal microscopy. Biomedical Optics Express. 2011;2:2231–2242. doi: 10.1364/BOE.2.002231. [DOI] [PMC free article] [PubMed] [Google Scholar]
- 7.Simon B, Dimarzio CA. Simulation of a theta line-scanning confocal microscope. Journal of Biomedical Optics. 2007;12:064020. doi: 10.1117/1.2821425. [DOI] [PubMed] [Google Scholar]
- 8.Tanbakuchi AA, Rouse AR, Gmitro AF. Monte Carlo characterization of parallelized fluorescence confocal systems imaging in turbid media. Journal of Biomedical Optics. 2009;14:044024. doi: 10.1117/1.3194131. [DOI] [PMC free article] [PubMed] [Google Scholar]
- 9.Henyey LG, Greenstein JL. Diffuse radiation in the galaxy. Astrophys J. 1941;93:70–83. [Google Scholar]
- 10.Cheong WF, Prahl SA, Welch AJ. A Review of the Optical-Properties of Biological Tissues. Ieee J Quantum Elect. 1990;26:2166–2185. [Google Scholar]
- 11.Liu JTC, Mandella MJ, Friedland S, Soetikno R, Crawford JM, Contag CH, Kino GS, Wang TD. Dual-axes confocal refletance microscope for distinguishing colonic neoplasia. Journal of Biomedical Optics. 2006;11:054019. doi: 10.1117/1.2363363. [DOI] [PMC free article] [PubMed] [Google Scholar]


