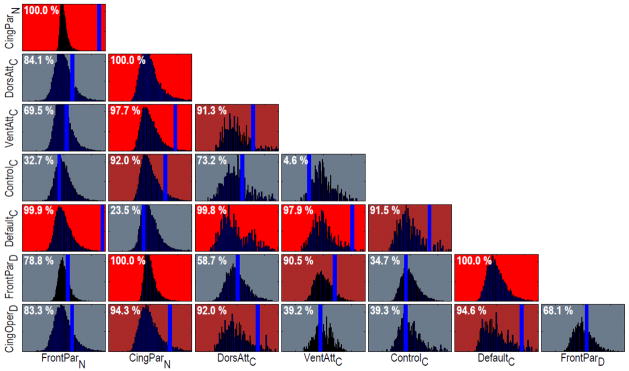
Figure 5.

Network comparison. A multivariate comparison with permutation testing was used to compare pairs of networks. The distributions portray the null distribution of possible differences between each pair. The blue vertical bars indicate the observed difference, which is shown on top of each box in terms of its percentile relative to the null distribution (when not shown, the bar was located to the right of the displayed area). For illustration, comparisons with percentiles > 95% are shown in red and comparisons with percentiles > 90% are shown in magenta. For example: FrontoParietalN and CinguloParietalN were very different, DorsalAttentionC and VentralAttentionC were distinct but to a lesser extent, and CinguloParietalN and DefaultC were similar.
