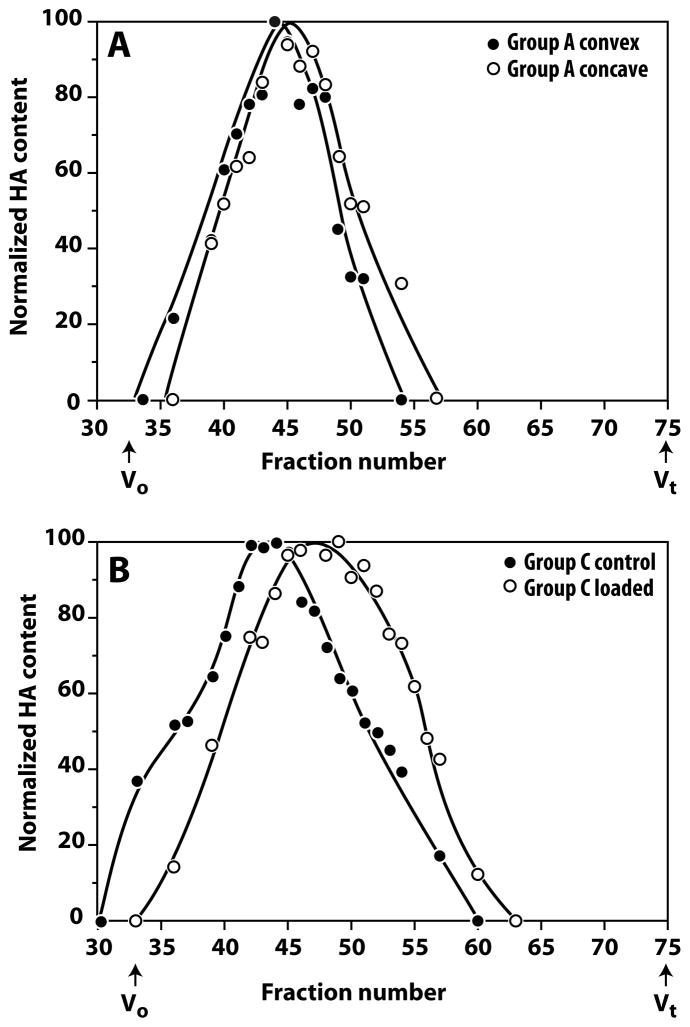
Figure 5.
Hyaluronic acid size variation in angulated and compressed rat discs. Pooled extracts from angulated and compressed discs were analyzed for HA size variation by chromatography through Sephacryl S1000. Panel A compares the convex and concave sides of the instrumented (loaded) angulated disc (Group A). There is a small decrease in HA size in the concave side relative to the convex side. Panel B compares the instrumented (loaded) and distal control discs of the compression group (Group C). There is a major decrease in HA size in the loaded disc. Vo and Vt represent the void and total volumes of the column, respectively.

