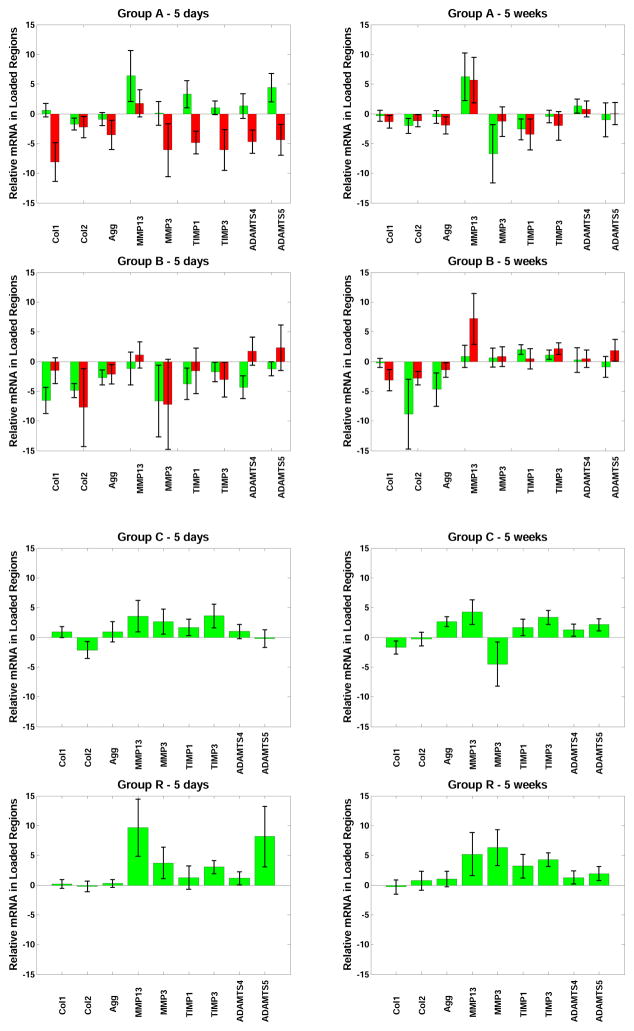
Figure 7.
Gene expression for Collagen 1, Collagen 2, Aggrecan, MMP13, MMP3, TIMP1, TIMP3, ADAMTS4, and ADAMTS5 by real time RT-PCR after 5 days and after 5 weeks in Groups A, B, C and R (mean values and standard deviations). Values are expressed exponentially as fold-change, relative to within-animal controls, hence on the vertical; axis, 0 = no difference, 1 = a doubling of mRNA, 2 = 4 times the mRNA as in control, etc. For Groups A and B, the left column corresponds to disc tissue on the convex side of the tail, and the right column corresponds to tissue on the concave side of the tail.

