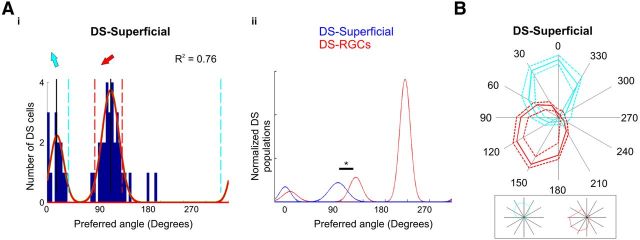
Figure 3.
Direction-selective cells at the superficial neuropil. Ai, Cumulative histogram of summed vector angles for DS superficial cells- population peak centers; 21° and 126° (solid red curves). Aii, Summed distributions of previously identified DS-RGCs (red) and DS superficial cells (blue), areas are normalized to the most coherent population. Note population centered at 126° that is not present in the RGC population ; asterisk, Welch's t test, p < 0.05. B, Normalized responses of the two populations of DS-superficial cells; mean (solid line) and dashed (±1 SD). Response plots within box are single, representative DS superficial cells within each population.

