
Figure 3.
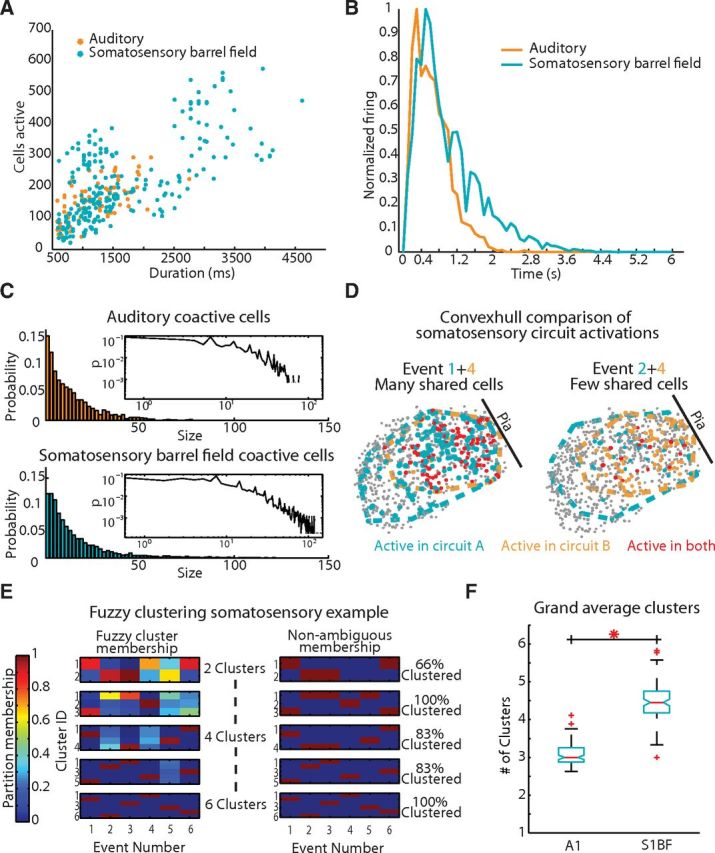
Temporal analysis of circuit activations reveals similar network dynamics. A, Event size and duration are correlated and follow the same correlative relationship (r = 0.6852). B, Averaged normalized firing rate histogram of circuit events. C, Coactive cells observed in an imaging frame across regions Inset, Log-log plot. D, Convexhull examples of S1BF events compressed in time. Left, Event 1 (blue), and Event 4 (orange) and their corresponding convex hull outline and participant cells. Cells active in both events are marked red. Right, Event 4 (orange) with Event 2 (blue). E, Fuzzy clustering example in a field of view containing six events. Total clusters are increased and partition membership is accessed for each event. For each nonambiguous membership, an event is characterized as red on the right. Three clusters are sufficient for total nonambiguous cluster membership. F, Distribution of grand average clusters representing each area after 100 fuzzy-c means iterations (p = 3.710 × 10⁻³³).