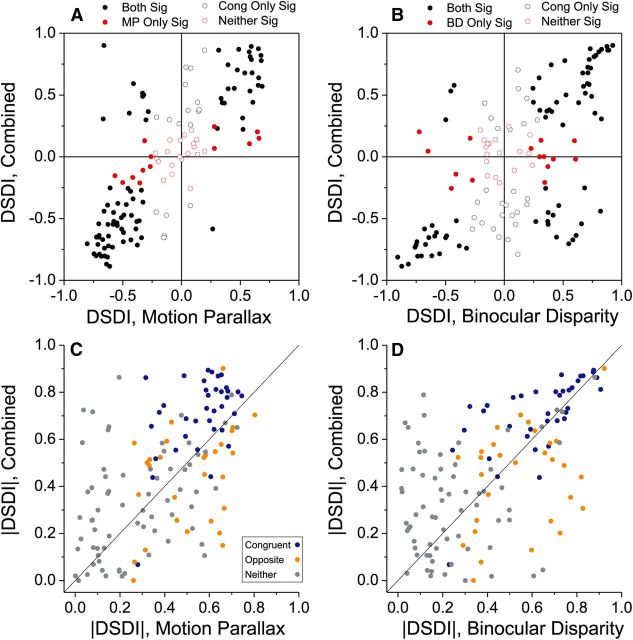
Figure 5.
Comparison of depth-sign selectivity between the single-cue conditions and the Comb condition. A, DSDI values for the Comb condition are plotted against those for the MP condition. All neurons are included (N = 133) except for one cell for which the Comb condition was not tested. Filled black symbols denote cells with significant selectivity in both conditions (permutation tests, p < 0.05), whereas filled red symbols denote cells with significantly selectivity for the MP condition only. Open black symbols indicate cells with significant selectivity in the Comb condition, whereas open red symbols indicate that selectivity was significant in neither condition. B, DSDI values for the Comb versus BD conditions. Format as in A. C, The absolute value of DSDI for the Comb condition is plotted against absolute DSDI for the MP condition (N = 133). Symbol colors denote congruent (blue, N = 37), opposite (orange, N = 29), and unclassified (gray, N = 67) cells. D, The absolute value of the DSDI for the Comb condition versus that for the BD condition. Same format as C.

