
Figure 7.
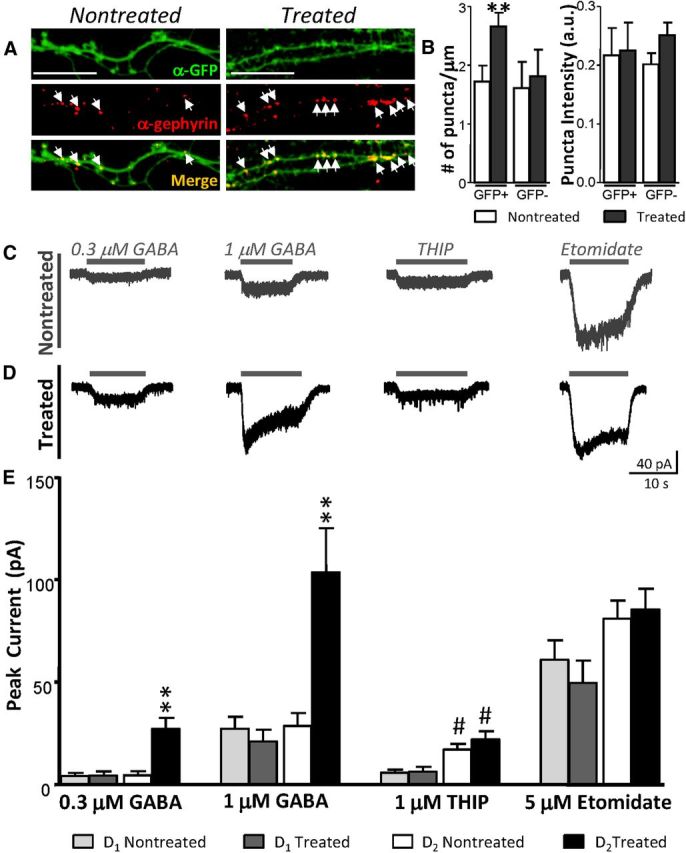
Enhanced GABAA sensitivity in D2 MSNs following D2R activation. A, Confocal images of D2 MSN segments with GFP (green) and gephyrin (red) staining in nontreated (left) and quinpirole-treated (right) conditions. Scale bar, 5 μm. B, Summary plots of gephyrin puncta density (left) and puncta intensity (right) of identified GFP+ and GFP− dendrites (**p < 0.01; Mann–Whitney U test). C, D, Representative currents in response to direct Y-tube application of GABA, THIP (1 μm), and etomidate (5 μm) in nontreated (C) and treated (D) D2 MSNs. E, Summary of direct drug effects in D1 and D2 MSNs in each experimental condition (n = 16–24 cells/group; Kruskal–Wallis test with Dunn's post test: *p < 0.05, **p < 0.01, ***p < 0.001 comparing the same cell type between conditions; #p < 0.05, ##p < 0.01 comparing different cell types within conditions).