
Figure 5.
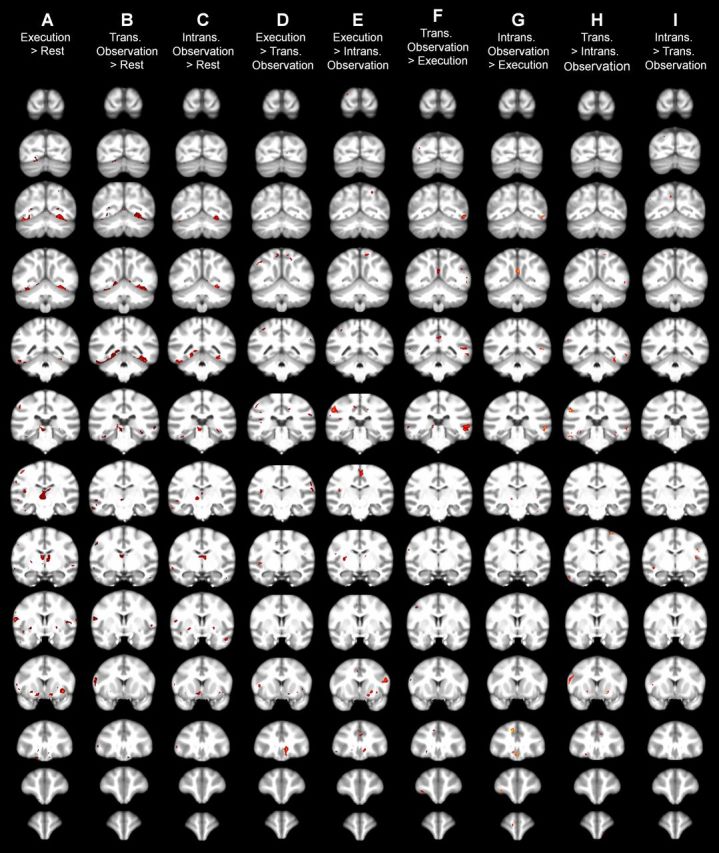
Coronal slices of group-level SPM statistical comparisons between conditions. Left hemispheres appear on the left. SPM5 analysis thresholded at p < 0.05.
Official websites use .gov
A
.gov website belongs to an official
government organization in the United States.
Secure .gov websites use HTTPS
A lock (
) or https:// means you've safely
connected to the .gov website. Share sensitive
information only on official, secure websites.
Coronal slices of group-level SPM statistical comparisons between conditions. Left hemispheres appear on the left. SPM5 analysis thresholded at p < 0.05.