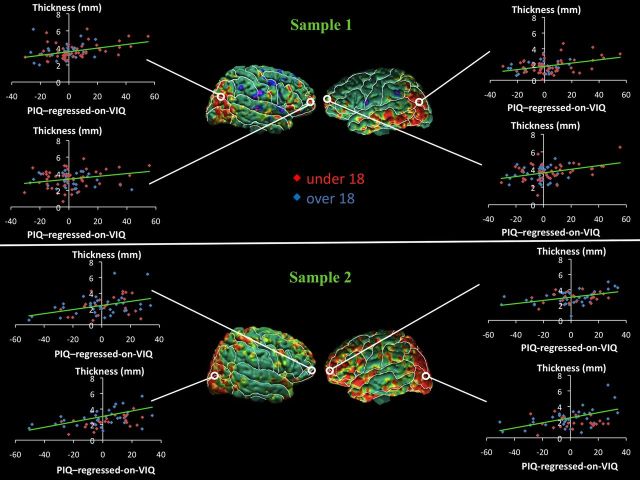
Figure 4.
Scatterplots for correlations of cortical thickness (CT) with PIQ-regressed-on-VIQ scores. Maps of correlation of PIQ-regressed-on-VIQ with CT, corrected for multiple comparisons using FDR, and scatterplots. In the scatterplots, CTs (in millimeters) are plotted on the y-axis, and the PIQ-regressed-on-VIQ scores are plotted on the x-axis. The scatterplots show the positive relationship between CT and PIQ-regressed-on-VIQ scores in the right and left anterior and posterior regions of the cortex in both samples. CT increases as the PIQ-regressed-on-VIQ score becomes more positive in all regions. For CT with PIQ-regressed-on-VIQ in right posterior cortex, r = 0.35 (p < 0.0012) in sample 1, and r = 0.48 (p < 0.0002) in sample 2; in left anterior cortex, r = 0.34 (p < 0.0015) in sample 1, and r = 0.42 (p < 0.0009) in sample 2. Top, Maps of sample 1, N = 83. Bottom, Maps of sample 2, N = 58.

