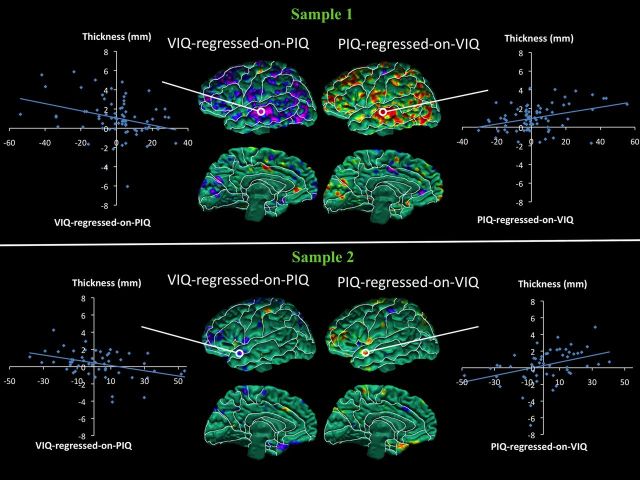
Figure 6.
Correlations and scatterplots of VIQ-regressed-on-PIQ and PIQ-regressed-on-VIQ scores with asymmetry in cortical thickness (CT). Maps of correlation of VIQ-regressed-on-PIQ and PIQ-regressed-on-VIQ scores with asymmetry in CT (left hemisphere CT minus right hemisphere CT), corrected for multiple comparisons using FDR. Asymmetry correlated inversely with the magnitude of the VIQ-regressed-on-PIQ score in inferior occipital (sample 1), middle occipital (sample 1), middle temporal (sample 1), superior temporal (both samples), precentral (sample 1), inferior frontal (both samples) and middle frontal (both samples) gyri (Fig. 6). We detected a significant positive relationship between the magnitude of the PIQ-regressed-on-VIQ score and the degree of CT asymmetry in the same regions listed above. Top, Maps of sample 1, N = 83. Bottom, Maps of sample 2, N = 58.

