
Figure 10.
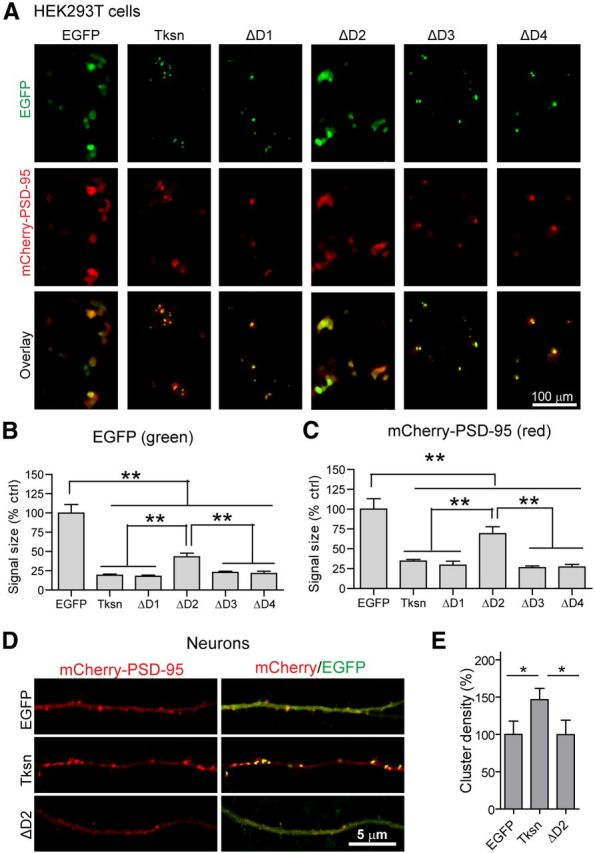
D2 is required for PSD-95 clustering by α1-takusan. A, Images showing overexpressed mCherry-PSD-95 (red, middle) and EGFP or one of the following EGFP fusion proteins (green, top): EGFP-Tksn, EGFP-ΔD1, EGFP-ΔD2, EGFP-ΔD3, or EGFP-ΔD4 in HEK293T cells. Overlay images of mCherry and EGFP are shown at the bottom. Scale bar, 100 μm. B, The size of green fluorescent signals was used as a measure of protein clustering. Similar to the results shown in Figure 9, B and D, EGFP-Tksn, ΔD1, ΔD3, and ΔD4 fusion proteins form clusters of much smaller sizes, while EGFP and EGFP-ΔD2 proteins are dispersed. n = 4. C, The clustering of mCherry-PSD-95 proteins was also analyzed in the same manner. The fluorescence signals in cells expressing Tksn, ΔD1, ΔD3, or ΔD4 are significantly smaller in size than in cells expressing EGFP or ΔD2, suggesting increased clustering. D, Images showing the level of overexpressed mCherry-PSD-95 (red) and EGFP, EGFP-α1-takusan (Tksn), or EGFP-ΔD2 (green) in the dendrites of cultured cortical neurons. The left panels show red signals from mCherry, and the right panels are the overlay of mCherry and EGFP. E, Quantification of mCherry-PSD-95 clusters in the dendrites. The density of mCherry-PSD-95 clusters was significantly increased by overexpressed Tksn (146.6 ± 15.0% of control), but not by ΔD2 overexpression (99.6 ± 19.2% control). n = 10. Values are normalized to EGFP controls and are mean ± SEM. **p < 0.01, *p < 0.05, one-way ANOVA.