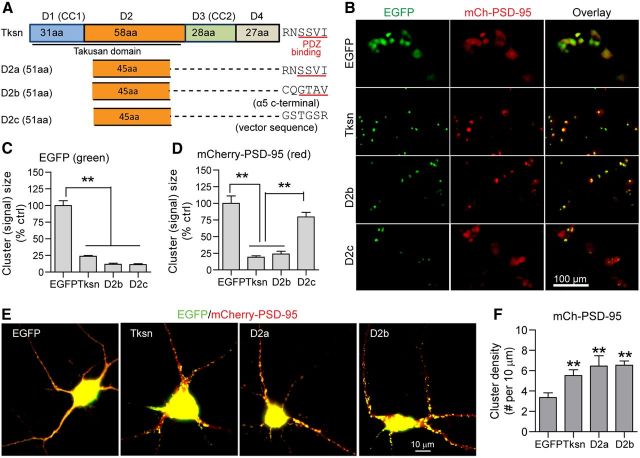
Figure 11.
D2 is sufficient to enhance PSD-95 clustering. A, A schematic diagram depicting the structures of full-length α1-takusan (Tksn) and three takusan-derived proteins, D2a, D2b, and D2c. Each takusan derivative contains a D2 of α1-takusan and a 6 aa sequence, which is the PDZ-binding motif of α1-takusan (D2a), the PDZ-binding motif of α5-takusan (D2b), or the non-PDZ-binding vector sequence (D2c). B, Images of EGFP (green, left), mCherry-PSD-95 (red, middle), and overlay (right) in HEK293T cells cotransfected with mCherry-PSD-95, and either EGFP, EGFP-Tksn, EGFP-D2b, or EGFP-D2c. C, The size of green fluorescent signals was used as a measure of protein clustering. EGFP-Tksn, D2b, and D2c fusion proteins form clusters of much smaller sizes, while EGFP proteins are dispersed. D, The clustering of mCherry-PSD-95 proteins was analyzed in the same manner. The fluorescence signals in cells expressing Tksn or D2b, but not D2c, are significantly smaller in size than in EGFP control cells. E, Images (overlay) showing the expression of mCherry-PSD-95 (red) and cotransfected EGFP, EGFP-Tksn, EGFP-D2a, or EGFP-D2b (green) in cultured cortical neurons. F, Quantification of the density of mCherry-PSD-95 clusters (cluster number per 10 μm length) on the dendrites of neurons cotransduced with EGFP, EGFP-Tksn, EGFP-D2a, or EGFP-D2b. The density of mCherry-PSD-95 clusters was significantly increased in neurons overexpressing Tksn (5.52 ± 0.57), D2a (6.47 ± 1.00), or D2b (6.54 ± 0.42) when compared with EGFP control (3.36 ± 0.46). Values are mean ± SEM. n = 8–18. **p < 0.01.

