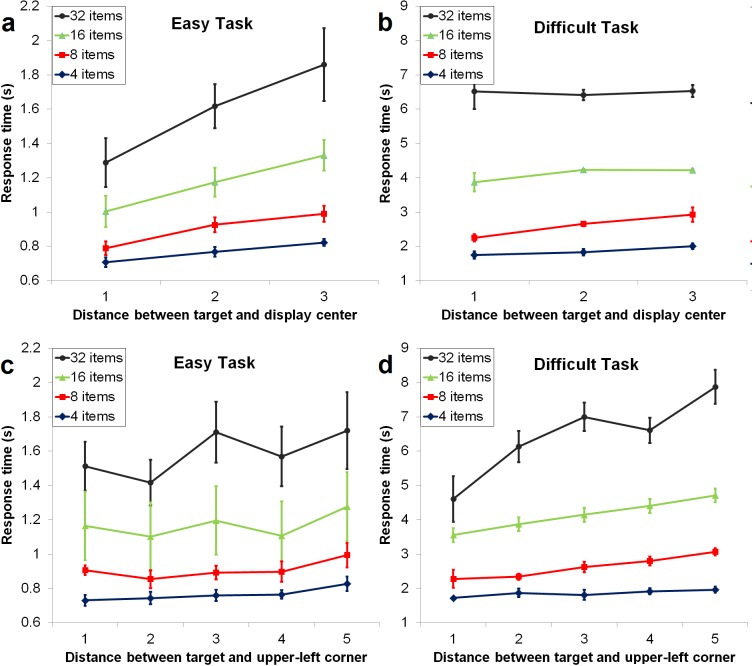
Figure 8.
Response time as a function of target position in the easy task (a, c) and the difficult task (b, d). Target position is represented by the city-block distance between the target and the display center (a, b) or between the target and the upper-left display corner (c, d). Note the different y-scales for the two tasks.

