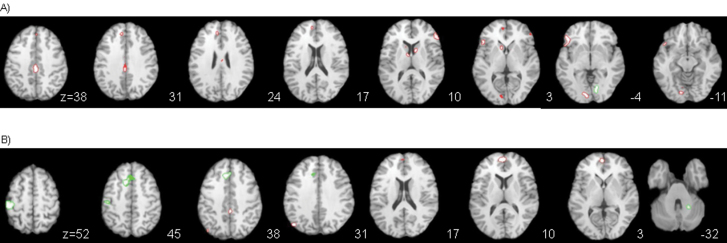
Fig. 2.
Statistical parametric maps of the main effect contrast for A) source of speech; red = self > alien speech and green = alien > self speech; B) distortion; red = original > distorted speech and green = distorted > original speech. The left side of the brain is showed on the left side of the images. The level of axial sections is indicated in Z coordinates in mm.

