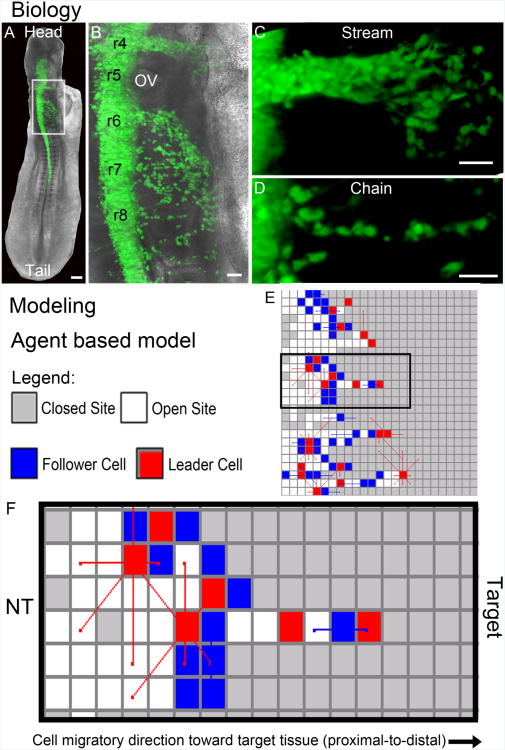
Figure 1. Neural crest cell migratory pattern in development and computational model schematic.
(A-D) Biology. (A) Typical fluorescently labeled chick embryo at approximately 20 somites with labeled neural crest cells (pMES-GFP; green) emigrating from the dorsal neural tube and migrating throughout the head and post-otic region. (B) A close-up view of the box in (A) showing the rhombomere (r) segments r4-r8 and variation in neural crest cell migratory behaviors in (C) streams and (D) chains. (E-F) Modeling. (E) The agent based model framework with an example simulation, including the (F) expanded view of the middle simulation with the neural tube (left) and target (right) and cell migratory direction pointing from left to right. The scalebars are (A) 100um, (B-D) 50um.

