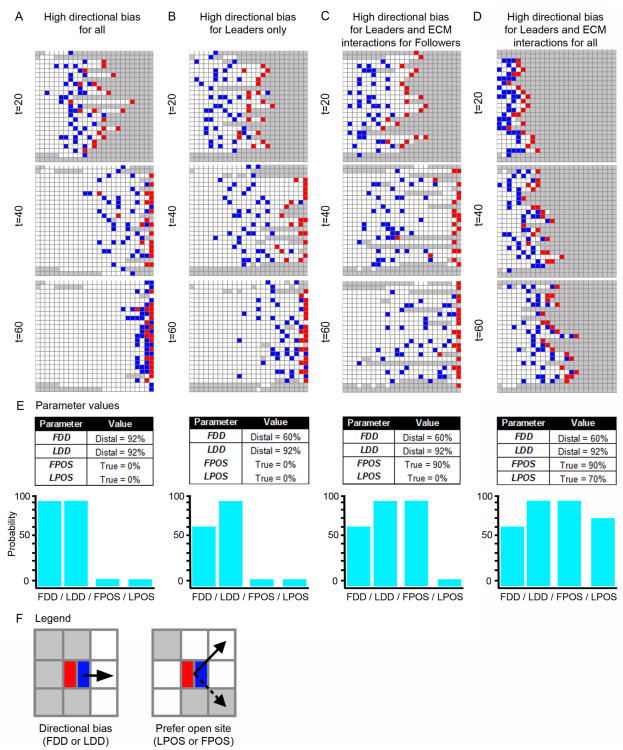
Figure 3. Simulation results for high directional bias and ECM interactions.
Simulated NC cell migratory behaviors under four distinct parameter regimes, shown at time (t) = 20, 40, and 60. (A) A representative simulation under a parameter regime with high directional bias for all agents (see (E) for parameter values). (B) A representative simulation under a parameter regime with high Leader directional bias and moderate Follower directional bias (see (E)). (C) A representative simulation under a parameter regime with high Leader directional bias, moderate Follower directional bias, and Followers with a strong preference to only move in OPEN sites on the grid (see (E) for parameter values). (D) A representative simulation under a parameter regime with high Leader directional bias, moderate Follower directional bias, Followers with a strong preference to only move to OPEN sites on the grid, and Leaders with a moderate preference to only to OPEN sites on the grid (see (E) for parameter values). (E) Parameter values and graphs of the parameter values for each of the scenarios from (A-D). (F) Legend, with an example of directional bias (FDD/LDD) and preference for an open site (LPOS/FPOS). Agents: Leader (red) and Follower (blue).

