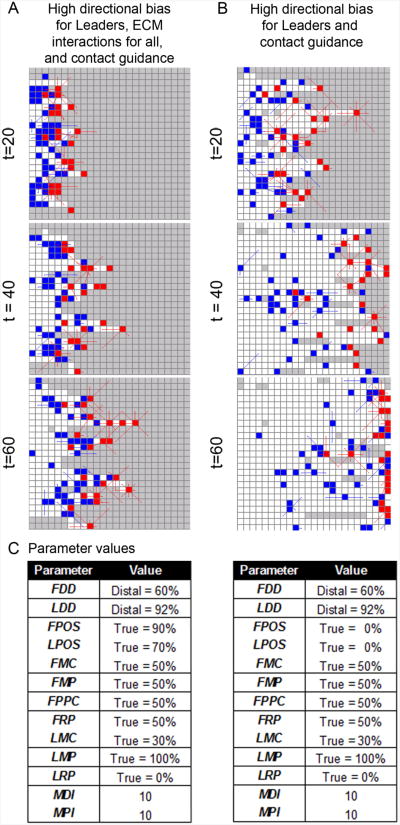
Figure 4. Simulation results with agents guided by cell-cell contact.
Simulated NC cells under two distinct parameter regimes that allow contact guidance are shown at time (t) = 20, 40, and 60. (A) A representative simulation using the same parameter regime as (Fig. 3D) except now with contact guidance (see (C) for parameter values. (B) A representative simulation using the same parameter values as (A) except now Leader and Follower agents no longer have a preference for moving to OPEN sites (i.e., LPOS and FPOS are 0%). (C) Parameter values for (A-B). Lines extending from agents are protrusions that can extend and retract according to probabilty distributions, random timers, and contact with other agents. Agents: Leader (red) and Follower (blue).

