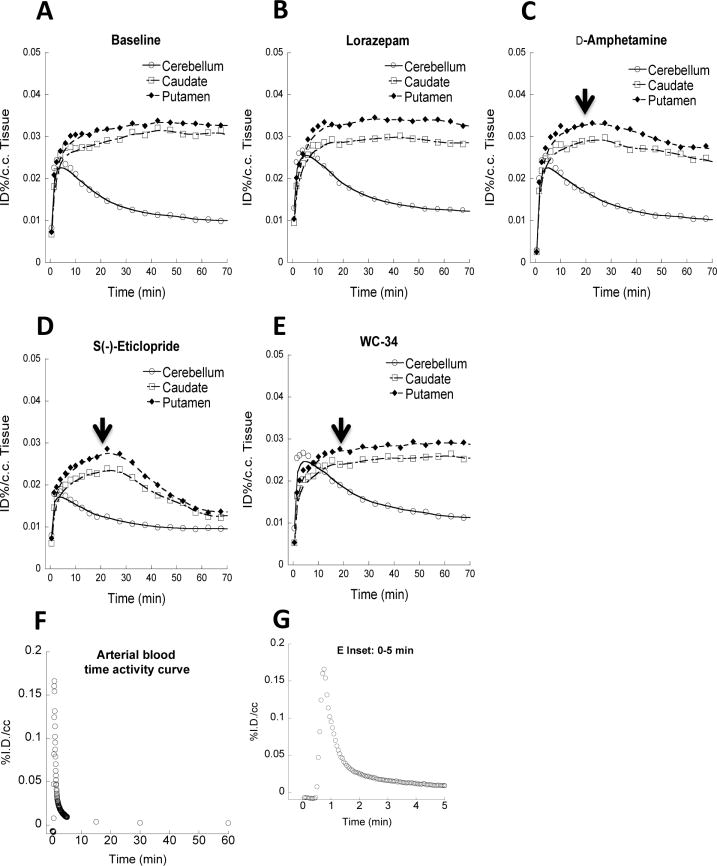
Figure 5.
Representative blood and Tissue time-activity curves (TACs) of [11C]SV-III-130 from microPET imaging studies. A and B show regional brain TACs from baseline and lorazepam studies. The uptake of [11C]SV-III-130 in the representative monkey brain regions (caudate, putamen and cerebellum) reached peak accumulation in the caudate and putamen 10 min post-i.v. injection. Lorazepam (1 mg/kg/i.v.) treatment didn’t increase [11C]SV-III-130 uptake in the caudate and putamen. C shows that 1 mg/kg d-amphetamine challenge slightly decreased [11C]SV-III-130 uptake in the caudate and putamen. Arrow shows the time point (20 min) when d-amphetamine was administrated. D shows that [11C]SV-III-130 uptake in the caudate and putamen was reversible, 0.025 mg/kg/i.v. s(−)-eticlopride rapidly displaced [11C]SV-III-130 binding to dopamine D2 receptors in the caudate and putamen. E shows that [11C]SV-III-130 uptake in the caudate and putamen was specific to dopamine D2 receptors, which was not displaced by 0.1 mg/kg/i.v. WC-34, a dopamine D3 receptor selective ligand. F shows the arterial blood TAC. The inset graph G shows the TAC of the initial 5 minutes.

