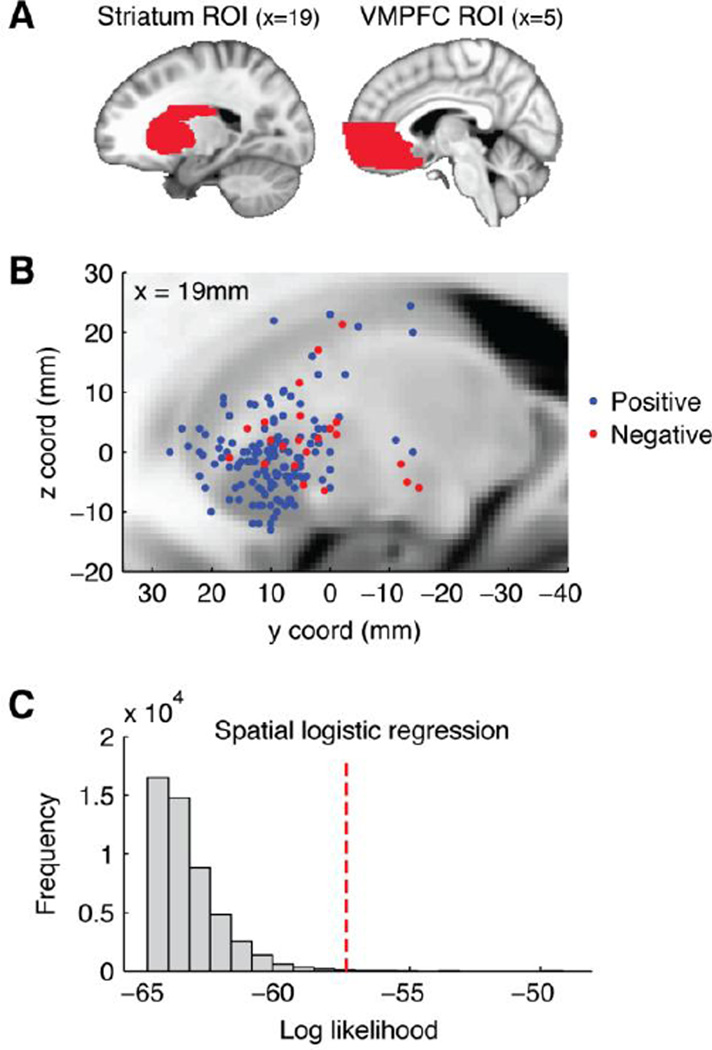
Figure 4.
Region-of-interest (ROI) analysis comparing positive and negative effects of SV on BOLD. A: Illustration of the two ROI masks. B: Scatterplot of foci for positive and negative effects in striatum. All foci are projected onto a single sagittal slice for visualization. Note that the five posterior/inferior foci fall in the putamen, lateral to the anatomical slice shown (|x|>=28). C: Permutation-based null distribution (gray histogram bars) and actual results (red line) for spatial logistic regression based on the data in Panel B.

