Fig. 2.
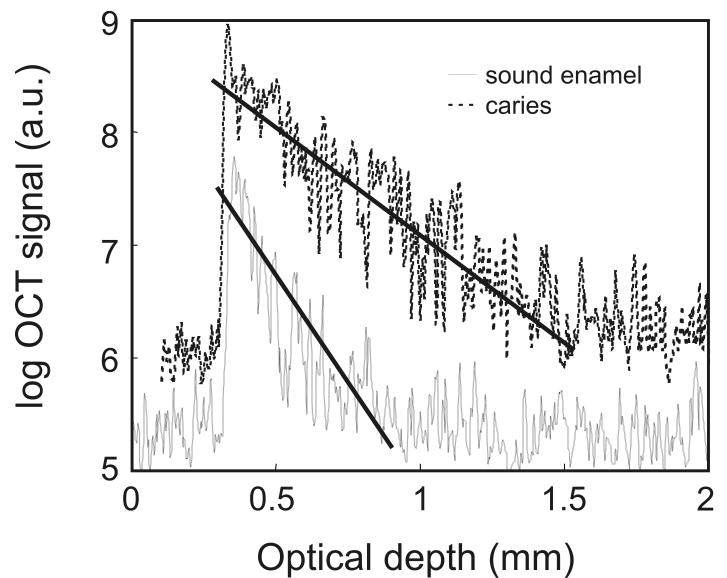
A) Representative A-scan depth profiles from regions of sound enamel and carious enamel. The fitting the exponential decaying slope of the OCT A-scans to derive the optical attenuation coefficient parameter (α) are illustrated with the solid lines. (a.u. = arbitrary units)
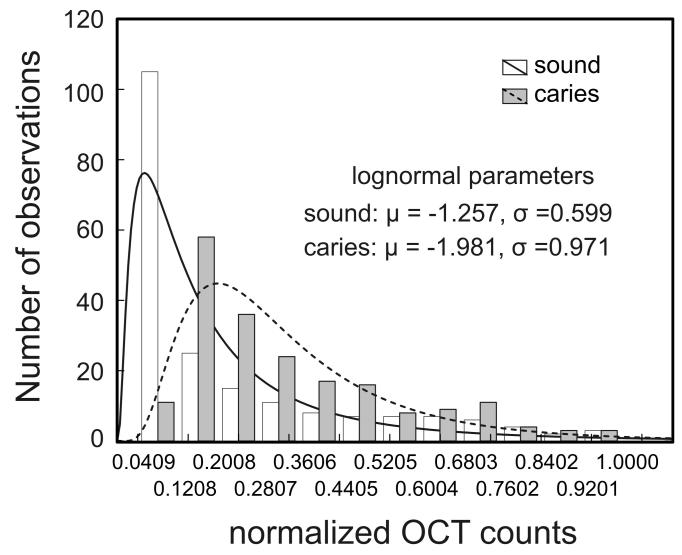
B) Histograms of the A-scan signal from sound and carious enamel along with the lognormal fit to the histogram.


