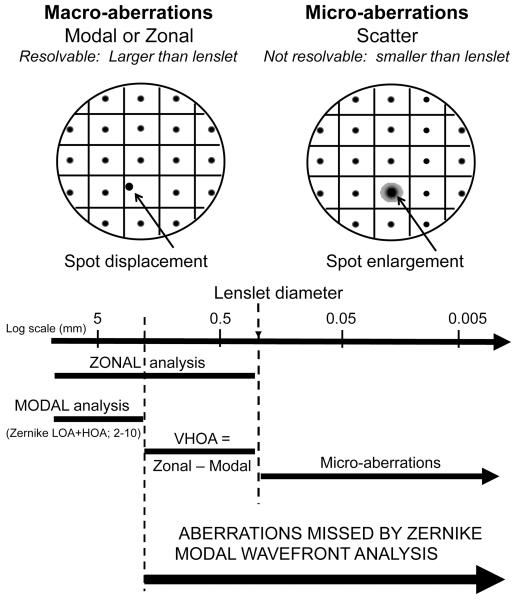
Figure 1.
Schematic raw SH data are shown in the top part of this figure. The left panel shows spot displacement (left arrow) as the basis of determination of macro-aberrations, while the right hand panel shows spot enlargement (right arrow) caused by micro-aberrations. The bottom half of this figure shows a size scale with courser aberrations on the left and finer aberrations on the right, quantified in mm in the pupil plane. The lines show the size range of macro-aberrations determined with either modal or zonal analysis, or from the difference between zonal and modal fitted wavefronts. Aberrations on a scale smaller than the lenslet diameter are indicated as micro-aberrations. The range of spatial scale missed by classic Zernike analysis is indicated by the thick black arrow.

