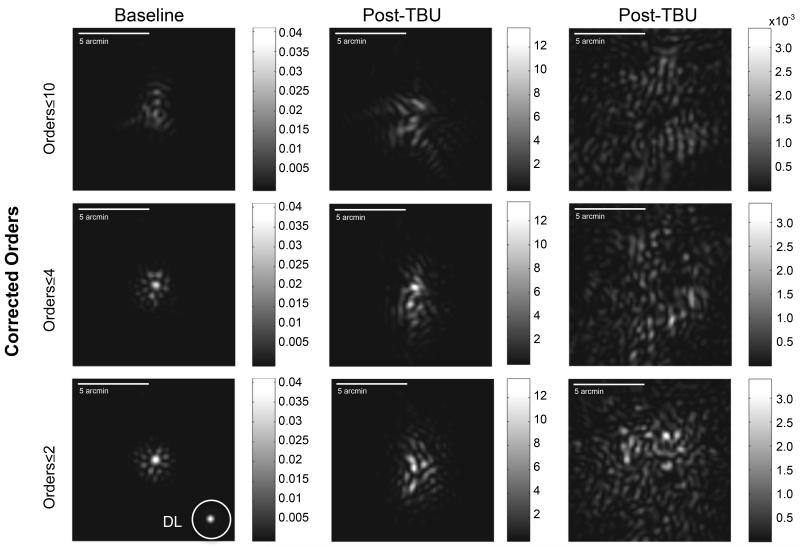
Figure 7.
Computationally simulated retinal PSFs were calculated from the zonal WFE maps obtained at baseline and after prolonged tear break-up (TBU) after either Zernike orders ≤2 , ≤4, or ≤10 were corrected by subtracting the WFEs determined by Zernike modes ≤2 , ≤4, or ≤10 from the zonal WFE maps. Sample data from a WFE map obtained soon after a blink (baseline) are shown in the left hand column, and examples of retinal PSFs computed from post-TBU wavefronts are shown in the center (less severe TBU) and right (more severe TBU) columns.

