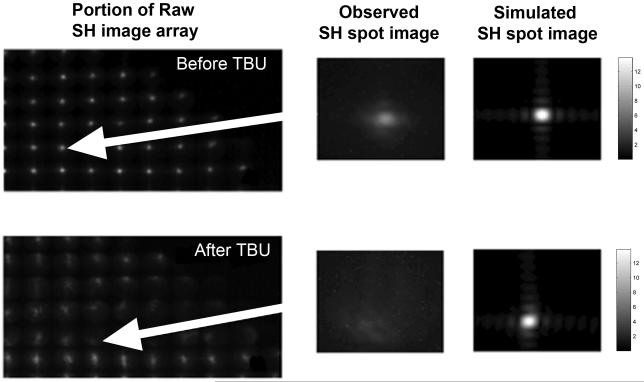
Figure 8.
Magnified views of individual and collections of raw SH point images obtained from subject #1 at baseline (top panels) or after TBU (bottom panels). Panels B and E show individual spot images extracted from the raw SH images (A and D) as indicated by the red arrows. Panels C and F show the same individual spot image computed using a computational SH simulator over a lenslet square aperture that employed the same wavelength and pupil size used in the experiment and included the same diffraction effects and the contribution to spot blur from the modal fitted HOAs. The square root transformation has been applied to spot images for display purpose. Equivalent widths for original double pass spot images (B and E) are 16 arcmin and 24 arcmin for the baseline and the tear break-up, respectively. Equivalent widths for simulated second pass spot images (C and F) are 6 arcmin and 6.8 arcmin for the baseline and the tear break-up, respectively.

