
FIGURE 3:
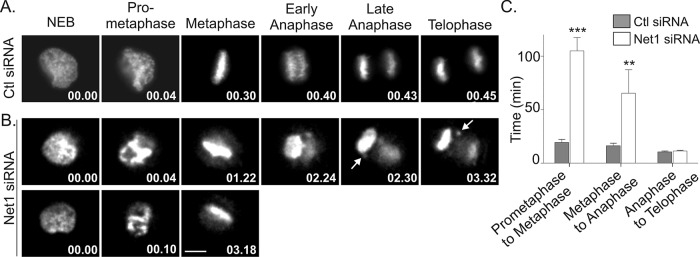
Net1 depletion interferes with mitotic progression. HeLa cells were transfected with control or Net1-specific siRNAs. One day later the cells were retransfected with a plasmid expressing mCherry-H2B. Live cell imaging was performed 2 d after that to monitor mitotic progression. (A) Representative still frames from control siRNA–transfected cells. The time elapsed from nuclear envelope breakdown is shown in the lower right-hand corner (minutes). (B) Mitotic progression in two different Net1 siRNA–transfected cells. Middle, arrows indicate lagging chromosomes. Bar, 10 μm. (C) Quantification of time required to progress through different phases of mitosis in control and Net1 siRNA–transfected cells. Errors are SEM. Statistical significance was determined by Student's t test; **p < 0.01; ***p < 0.001.