FIGURE 1:
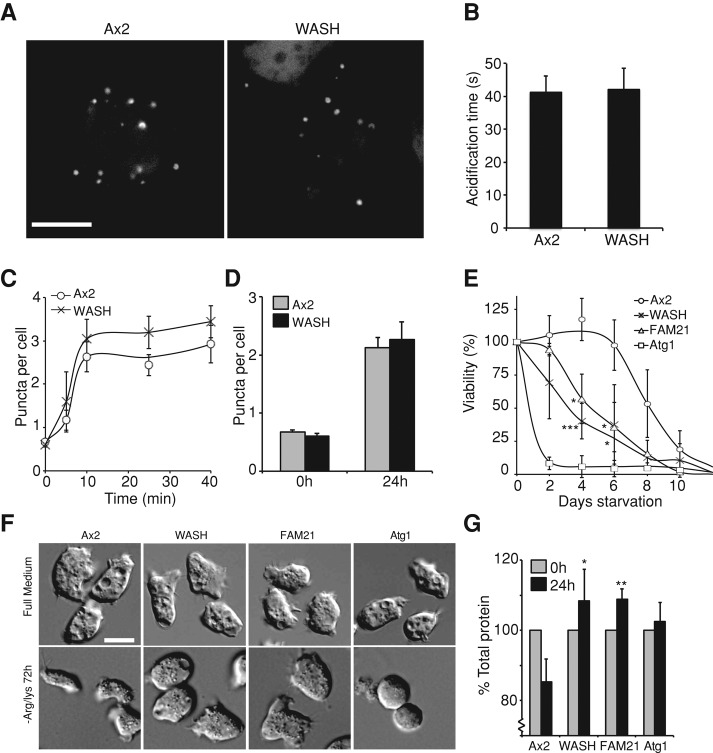
Autophagy in WASH mutants. (A) High-resolution imaging of autophagosome formation in GFP-atg8–expressing cells compressed under agar. Stills are taken from Movies S1 and S2. (B) Quantification of the time taken for the GFP signal of individual autophagosomes in cells treated as in (A) to fade after autophagosome formation was complete. (n > 50 autophagosomes in total for each strain). (C) Autophagy was induced by placing cells expressing GFP-atg8 in SIH-Arg/Lys. The number of autophagosomes was counted at each time point. (D) The steady-state levels of autophagosomes after 24 h of starvation. (E) Survival of mutants under Arg/Lys starvation. At each time point, viability was measured by the ability to reform colonies on bacterial plates. (F) Morphology of cells under starvation. DIC images of cells after 3 d in full medium or SIH-Arg/Lys. (G) Total protein of cells after 24 h of Arg/Lys starvation. All values plotted are the means ± SD of three independent experiments. *, p < 0.05; **, p < 0.01; ***, p < 0.005 (Student's t-test). Scale bars: 5 μm.

