
FIGURE 2:
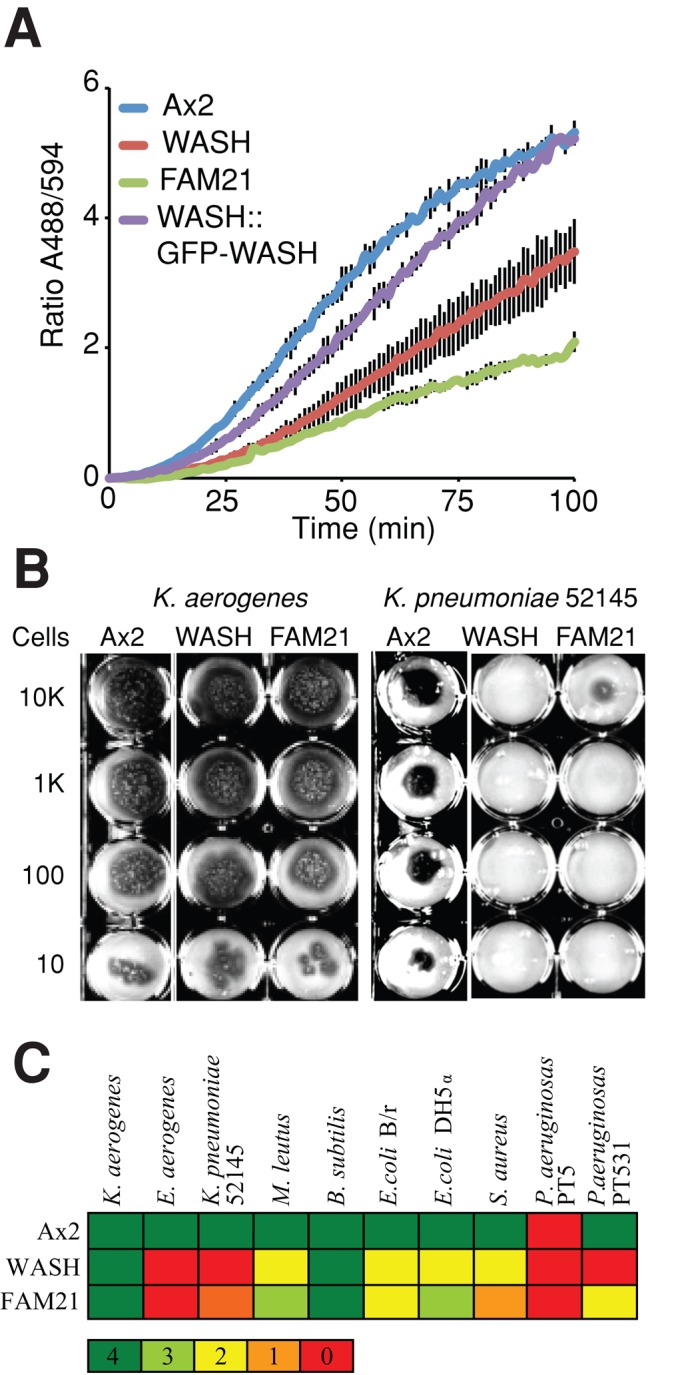
Phagocytic defects in WASH mutant cells (A) Proteolytic activity is decreased in WASH mutants, as measured by feeding cells DQ-BSA–labeled beads and measuring unquenching of the fluorophore over time. (B) WASH- and FAM21-null cells are unable to grow on certain bacteria. The indicated number of cells were seeded on the bacterial lawn, and Dictyostelium growth is indicated by the formation of dark plaques where the bacteria have been consumed. (C) Summary of mutant growth on various bacteria. The color code refers to the number of wells in (B) in which Dictyostelium were able to grow, indicating the severity of the growth defect.