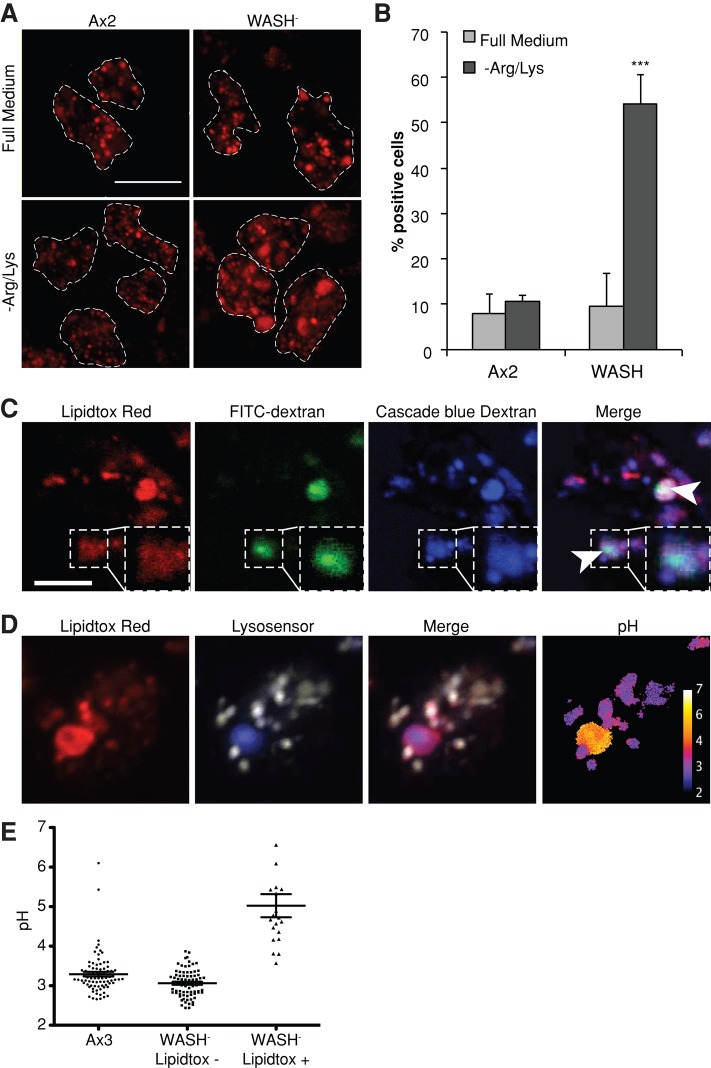
FIGURE 4:
Phospholipid accumulation in WASH-null cells. (A) Cells grown for 24 h in either full SIH or SIH-Arg/Lys in the presence of LipidTOX Red. Arrows indicate large phospholipid accumulations. Images are confocal maximum intensity projections. Scale bar: 10 μm. The proportion of cells containing these large accumulations (>1.5-μm diameter) is quantified in (B). More than 50 cells were scored for each sample, and the values plotted are the mean ± SD of three independent experiments. ***, p < 0.005 (Student's t-test). (C) Colocalization of LipidTOX Red accumulations with both FITC (pH-sensitive) and Cascade Blue (pH-insensitive) dextran. WASH-null cells were grown overnight in SIH-Arg/Lys supplemented with LipidTOX Red and both dextrans. Arrows indicate subdomains of brighter FITC-dextran fluorescence. Image shown is a single confocal plane. Scale bar: 5 μm. (D) Endocytic pH of cells starved overnight in medium containing LysoSensor yellow/blue dextran and LipidTOX Red. The LysoSensor emission at 450 nm and 510 nm is colored blue and yellow, respectively, in the LysoSensor panel and was used to calculate the pH in the false-colored final image. The distribution of pH in individual vesicles is shown in (E). All the LipidTOX Red–negative vesicles in 10 cells of each strain were measured and are compared with the pH within the LipidTOX Red accumulations in >20 WASH-null cells.

