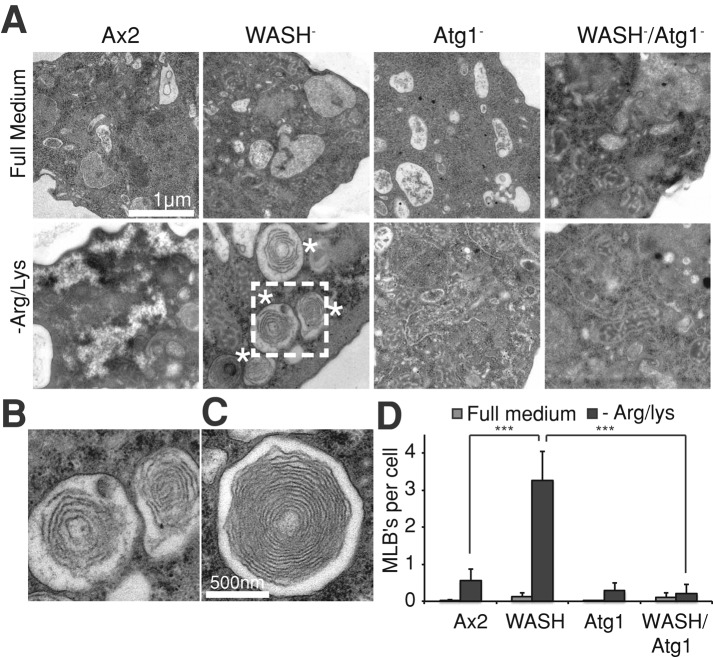
FIGURE 5:
Ultrastructural analysis of starved WASH mutants. (A) Cells were placed in either full or Arg/Lys-deficient medium for 36 h before processing for TEM. Micrographs show the formation of large MLBs in starved WASH mutant cells, as indicated by asterisks. (B) and (C) Enlarged images of MLBs, (B) is the boxed region in (A). (D) Quantification of MLB frequency. At cells were grown as indicated, and the number of MLBs was scored per section, per cell. At least 20 cells were scored for each sample, and values are the mean ± SD of three experiments. ***, p < 0.005 (Student's t-test).

