
FIGURE 6:
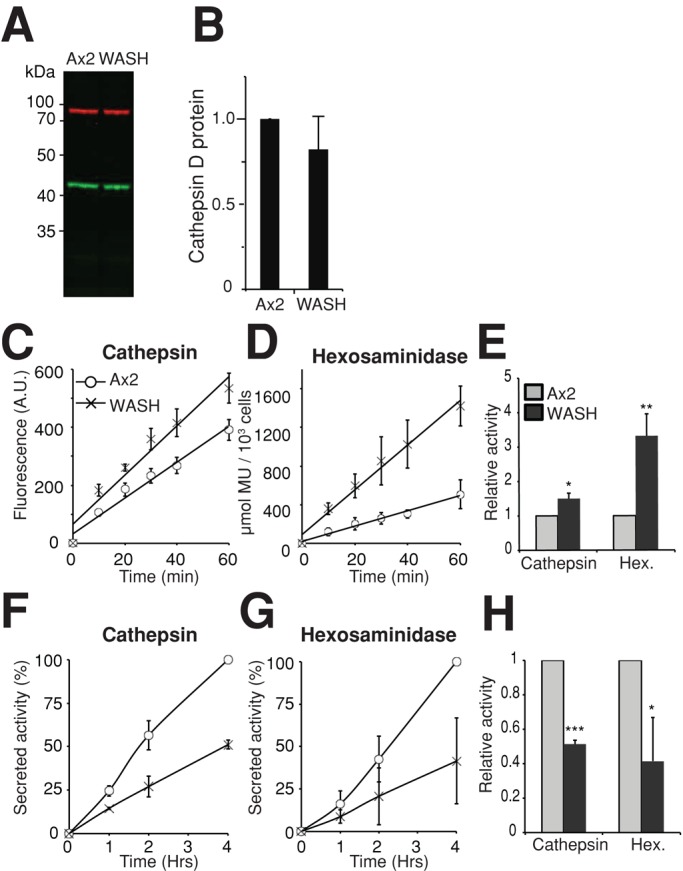
Hydrolytic activities in WASH mutants. (A) Western blot of catD (green) with 3-methylcrotonyl-CoA carboxylase α (MCCC1) as loading control in red. Quantitation of three independent blots shown in (B). (C–E) hydrolytic activity in Ax2 (circles) and WASH-null (crosses) whole-cell lysates using fluorogenic substrates for (C) cathepsin D/E and (D) β-hexosaminidase. Activity is indicated by the increase in fluorescence over time. (E) The relative activity of WASH-null cells (dark gray) compared with Ax2 (light gray). (F–H) Secreted activity of (F) catD and (G) β-hexosaminidase. Cells were placed in fresh media for the times indicated, and the activity in the media was measured as above. (H) Relative rates of secretion are plotted in (H). All values are the means ± SD of three independent experiments. *, p < 0.05; **, p < 0.01; ***, p < 0.005 (Student's t-test).