FIGURE 3:
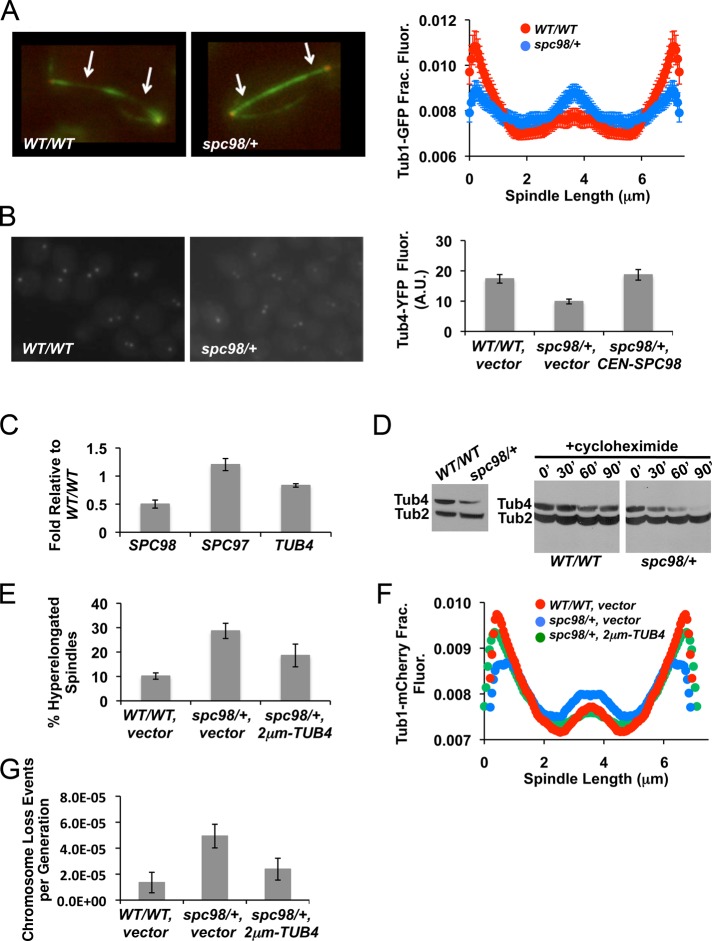
γ-Tubulin levels are crucial for anaphase spindle organization and accurate chromosome segregation. (A) Wild-type and spc98/+ mutant cells expressing Tub1-GFP were imaged by TIRF microscopy. Levels of Tub1-GFP were measured across the length of anaphase spindles. Mean intensity values normalized to the total fluorescence from each strain; error bars represent SE. The differences in Tub1-GFP distribution between wild type and spc98/+ are significant, as determined by the Kolmogorov–Smirnov test; p = 0.0011. Arrows point to regions flanking the midzone. (B) Metaphase wild type, spc98/+ mutant cells, and spc98/+ mutant cells carrying a low-copy (CEN) plasmid of SPC98 expressing Tub4-YFP were imaged, and total YFP fluorescence was quantified using MetaMorph. Mean fluorescence from ∼30 cells; error bars represent SE. (C) The levels of mRNA were measured using reverse transcription-PCR. The average amount of each transcript in spc98/+ mutants relative to wild-type cells in three independent replicates; error bars represent SE. (D) Western blot analysis for total Tub4-HA levels (left) and rate of turnover (right) in asynchronously growing cells or during cycloheximide treatment at various time points (in minutes) in wild type and spc98/+ mutants, respectively. Tub2 was used as a loading control. Two independent replicates were performed with similar results. (E) Asynchronously growing spc98/+ mutant cells that expressed Tub1-GFP with vector (2 μm) or a high-copy plasmid containing TUB4 (2 μm-TUB4) were imaged by fluorescence microscopy. Mean number of anaphase cells with spindles that are bent or have a fish-hook appearance from three independent experiments; error bars represent SE. (F) Levels of Tub1-GFP were measured across anaphase spindles from wild type with vector, spc98/+ with vector, or spc98/+ with 2 μm-TUB4. Mean intensity values normalized to the total fluorescence for each strain; error bars represent SE. Based on the Kolmogorov–Smirnov test, Tub1-GFP distributions in spc98/+ carrying 2 μm-TUB4 are the same as those of wild type with vector (p = 0.025), but spc98/+ carrying vector is significantly different from wild type with vector (p = 0.00014). (G) spc98/+ cells carrying 2 μm-TUB4 or vector control were assayed for chromosome loss as described in Figure 2. Mean chromosome loss rate from three independent replicates; error bars represent SE.

