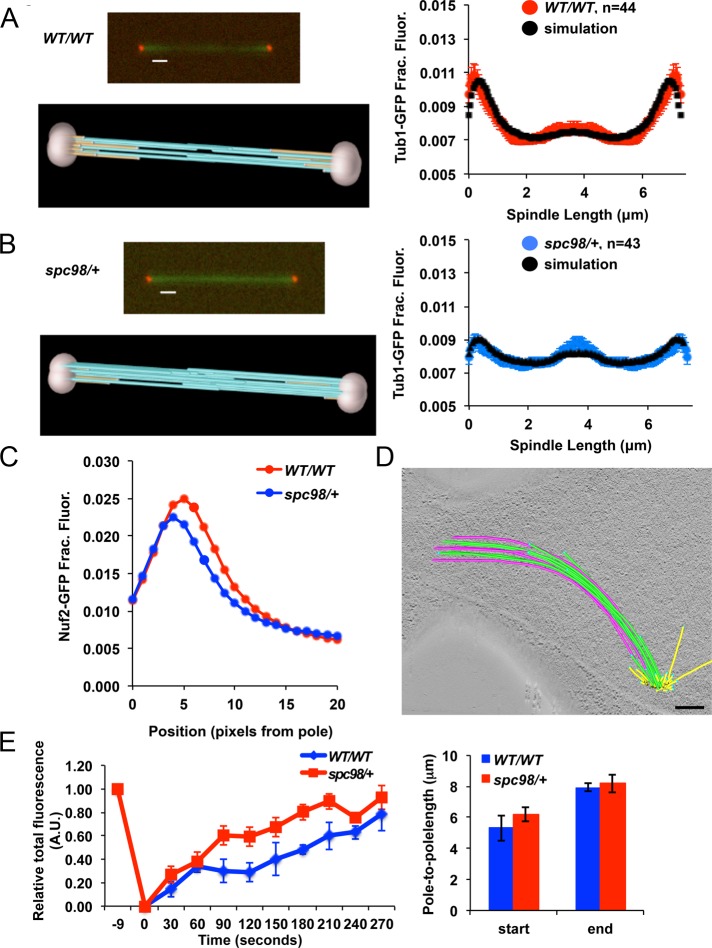
FIGURE 4:
Model convolution simulation, fluorescence microscopy, electron tomography, and FRAP reveal increased altered iMT and kMT assembly in spc98/+ mutants. (A, B) Model convolution simulation of Tub1-GFP distributions for wild-type and spc98/+ mutant cells. The simulations predict fewer kMTs (gold) and more iMTs (light blue) in spc98/+ mutants than in wild-type cells. (C) The distance between KT clusters and SPBs was measured in anaphase wild-type (red curve) and spc98/+ mutant cells expressing Spc110-mCherry to mark the spindle poles, Tub1-GFP to label microtubules, and Nuf2-GFP to mark kinetochores (blue curve). The plot indicates that spc98/+ mutants contain shorter kMTs than do wild-type cells; n = 42 for spc98/+ mutants, and n = 57 for wild-type cells. Average spindle length is 7.4 ± 1.5 μm in wild-type cells (mean ± SD) and 7.8 ± 2.3 μm in spc98/+ mutants. (D) Electron tomography revealed that spc98/+ spindles contained abnormal SPB positioning and spindle curvature (Figures 2D and 3A). More iMTs (green and pink) are present and have a much longer region of interdigitation than is typically found in wild-type cells. See also Supplemental Figure S2 and Supplemental Videos S1–S3. Bar, 200 nm. (E) FRAP (left) was performed on mid-anaphase spindles in spc98/+ mutant (n = 7) and wild-type cells (n = 4). A rectangular region (1.2 × 0.6 μm) over the mother–bud neck was photobleached, and the rate at which fluorescence was recovered normalized to total spindle fluorescence is plotted. In both strains the starting and ending spindle lengths are comparable (right).

