
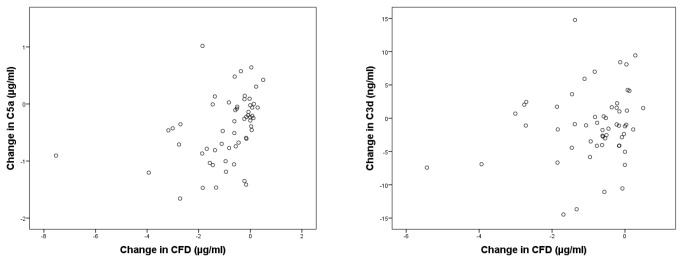
Figure 2. Change in serum concentration from baseline to 12 months for C5a (left) and C3d (right) as a function of the change in CFD concentration from baseline to 12 months (r=0.37, p=0.004 and r=0.18, p=0.16 respectively).
Official websites use .gov
A
.gov website belongs to an official
government organization in the United States.
Secure .gov websites use HTTPS
A lock (
) or https:// means you've safely
connected to the .gov website. Share sensitive
information only on official, secure websites.