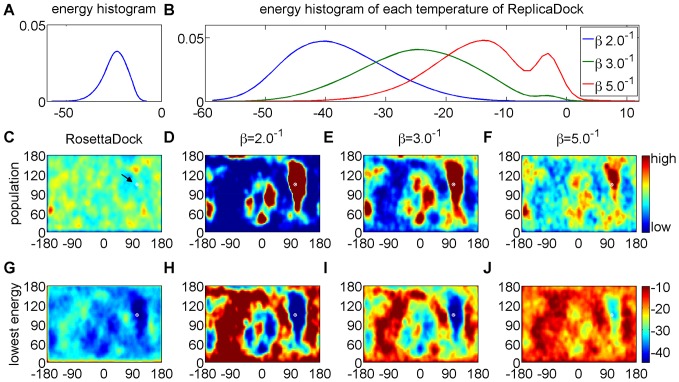
Figure 2. Detailed analysis of shotgun and ReplicaDock sampling on target 1ppf.
A) energy distribution of shotgun sampling generated low-resolution decoys. B) energy distribution of conformations sampled by ReplicaDock at respective inverse temperatures. C–F) Population of sampled conformations in spherical coordinates. Partner A is fixed at the center and the position of Partner B with respect to an idealized spherical surface around Partner A is recorded. The native structure is labeled as white dot (arrow in C). G–J) Conformations are assigned to grid-cells as in C–F, but shown is the lowest energy of all conformations assigned to the respective grid cell. The same color-scale is used for each plot of a row, and the colorbars are attached to the rightmost panel.

