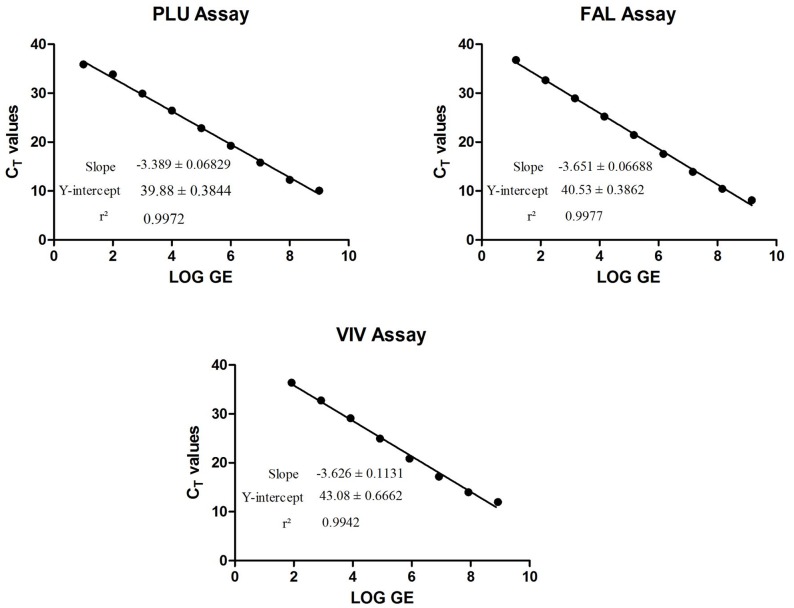
Figure 2. Linear regression plots for absolute qPCR assays.
Real-time PCR assays were performed using plasmid DNAs for each assay. Plasmid DNA was 10-fold serially diluted at each point and ran in 4–8 replicates. A linear regression plot was generated using GraphPad Prism. The slope, the Y-intercept and the r2 value were determined. Data shown confirms that these assays perform with high efficiencies.

