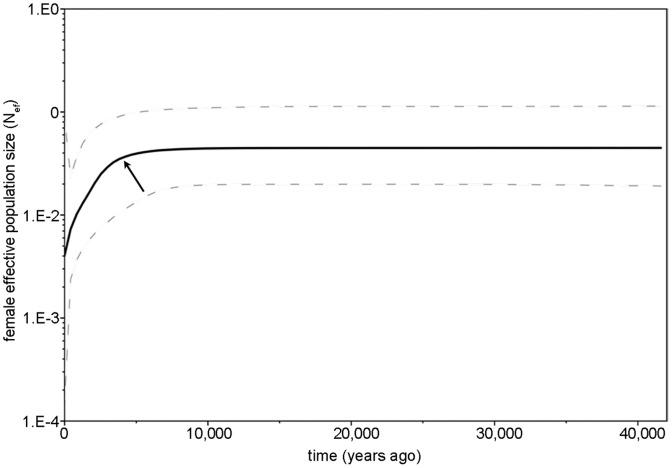
Figure 3. Bayesian Skyline Plot (BSP) displaying changes in female effective population size (Nef) through time in R. brelichi.
Calculations are based on 603 bp of the mitochondrial HVI region. Shown are the median (black) and the 95% highest posterior probability density (dashed lines) around the estimate. The arrow indicates the start of a reduction in Nef.

