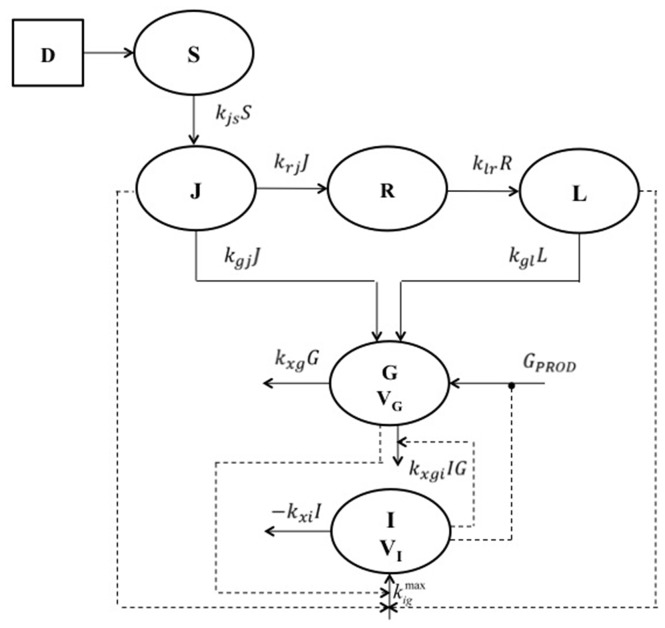
Figure 1. Block diagram of the model.
Schematic representation of the six-compartment model. D is the orally administered quantity of glucose. S represents the quantity of glucose in the stomach while J, R and L represent the glucose content in the jejunum, in a delay compartment and in the Ileum respectively. G indicates the compartment for the plasma glucose concentration and I indicates the insulin plasma concentration. Measurements were taken for plasma glucose and insulin concentrations. Continuous lines represent entry or exit fluxes while dotted lines represent stimulation (arrows) or inhibition (black circles) mechanisms.

