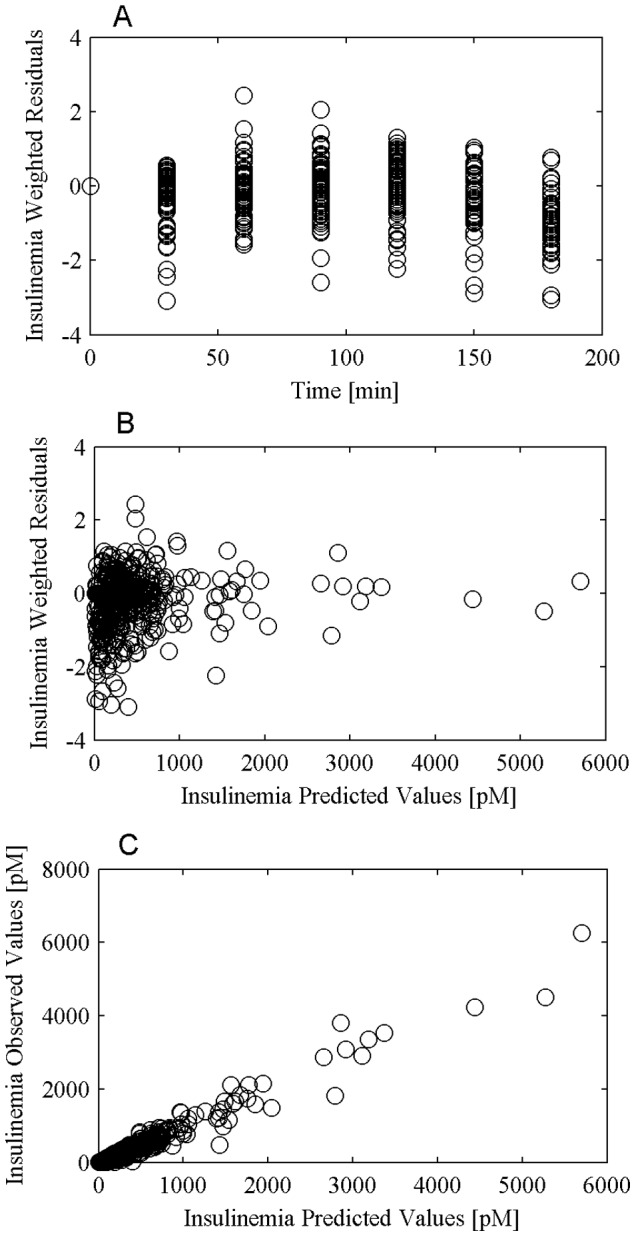
Figure 4. Insulin prediction diagnostic plot.

Panel A reports weighted residuals versus time, panel B reports weighted residuals versus insulin predictions and panel C reports observed concentrations versus predicted concentrations.

Panel A reports weighted residuals versus time, panel B reports weighted residuals versus insulin predictions and panel C reports observed concentrations versus predicted concentrations.