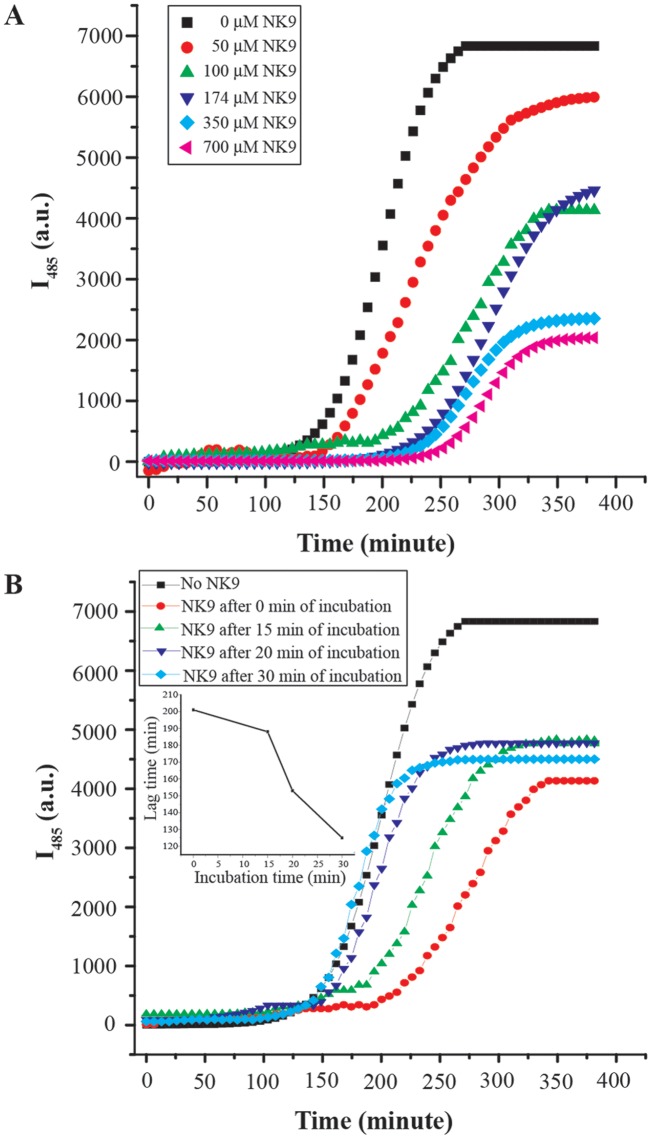
Figure 1. Time course of insulin fibrillation in the presence and absence of NK9, monitored using ThT fluorescence.
(A) Temporal evolution of the ThT fluorescence intensity during incubation of insulin (350 μM) in fibrillation condition (pH 2.6, 62°C) in presence and absence of NK9 at different concentrations. ThT curves of insulin in respective NK9 concentrations are mentioned in the figure. (B) Effect of NK9 on fibrillation kinetics of insulin. NK9 (100 μM) was added to the buffer solutions (pH 2.6) of insulin (350 μM) at 62°C at 0, 15, 20 and 30 min of incubation. Molar ratio of NK9 to insulin is 0.28∶1. Inset showed a plot of lag time of insulin fibrillation in presence of 100 μM NK9 against incubation time.

