
Figure 3. Effect of NK9 binding over secondary structure of insulin during insulin fibrillation monitored by circular dichroism.
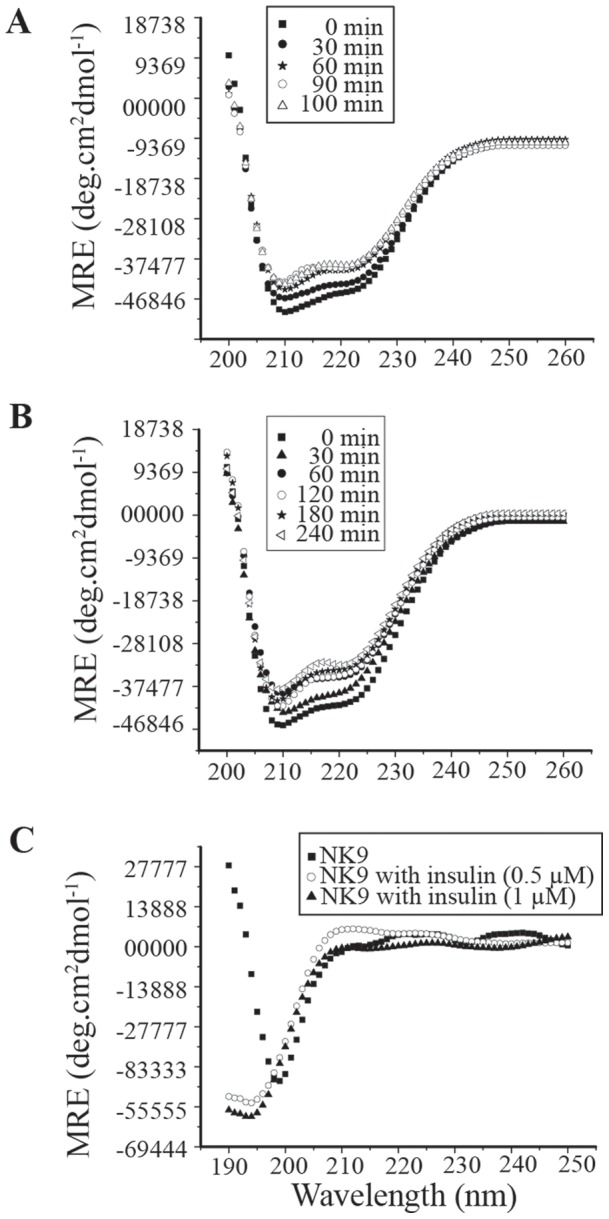
Selected buffer subtracted far-UV CD spectra of (A) Insulin (B) Insulin in presence of NK9 (NK9 spectra at these selected time points were subtracted from insulin NK9 spectra). (C) Far UV-CD spectra of NK9 in presence and absence of insulin (Insulin spectra was subtracted from NK9 insulin spectra). The concentration of insulin and NK9 both were 350 μM (insulin:NK9 = 1∶1). During the measurement the samples were diluted to 50 μM.