Fig. 3.
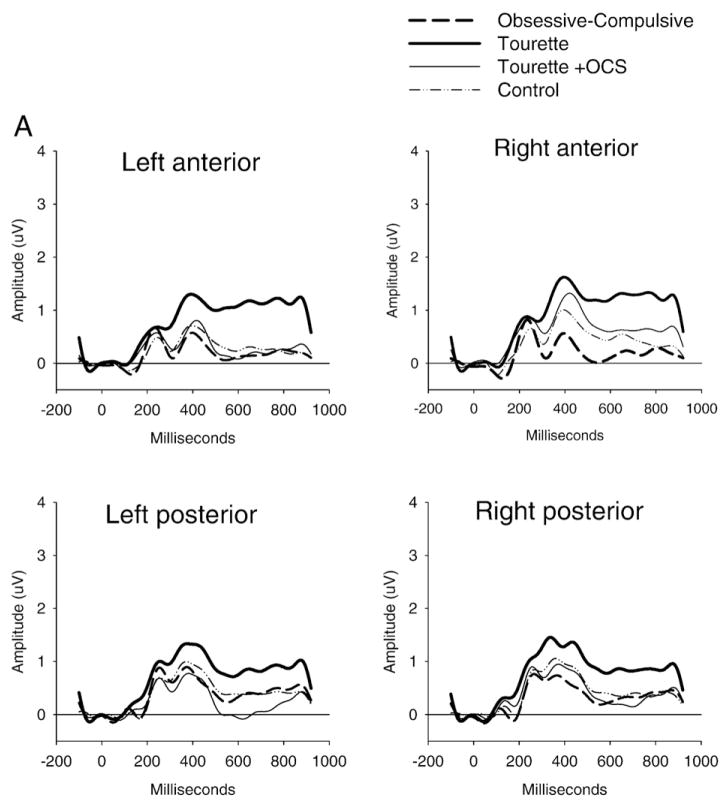
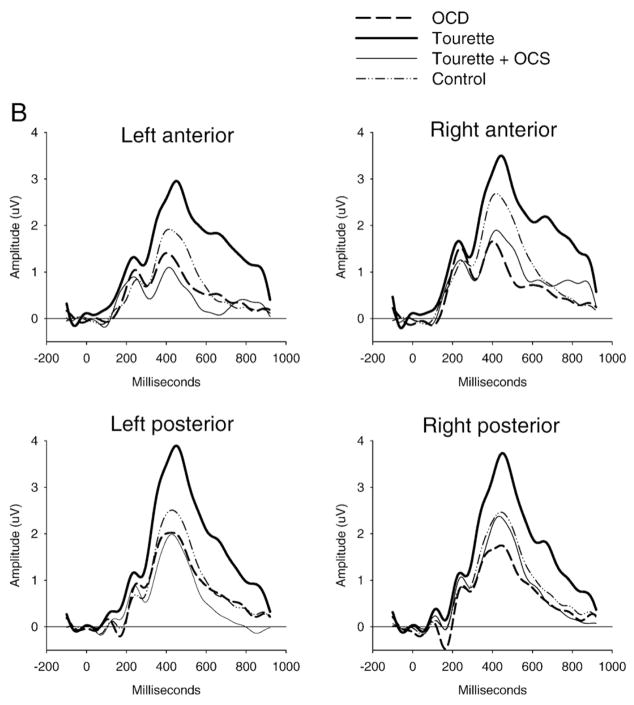
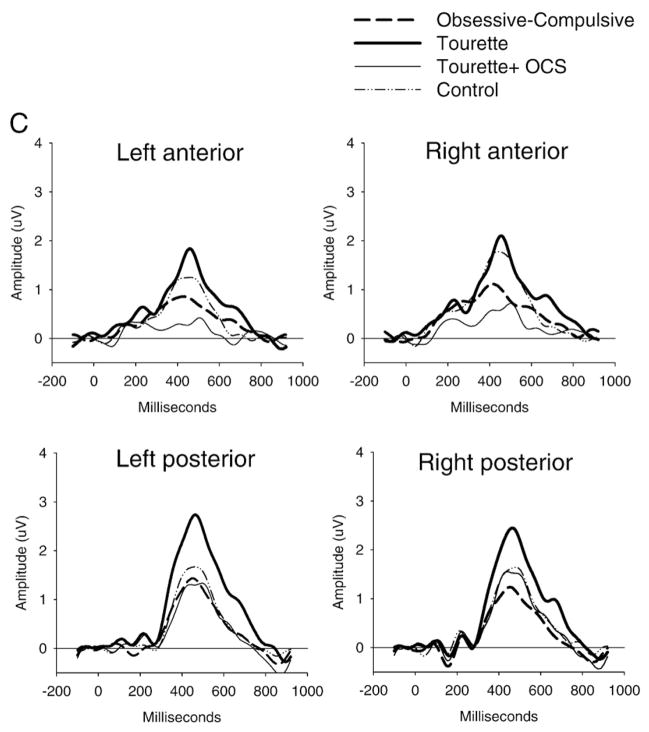
Stimulus-locked ERP waveforms to non-target (Panel A) and target stimuli (Panel B) and the difference between target and non-target stimuli (oddball effect: Panel C). The P300 component (around 450 ms) showed increased posterior amplitude in the GTS group and reduced anterior amplitude in the OCD and GTS+OCS groups for the target stimuli only, giving rise to an increased or decreased oddball effect respectively.


