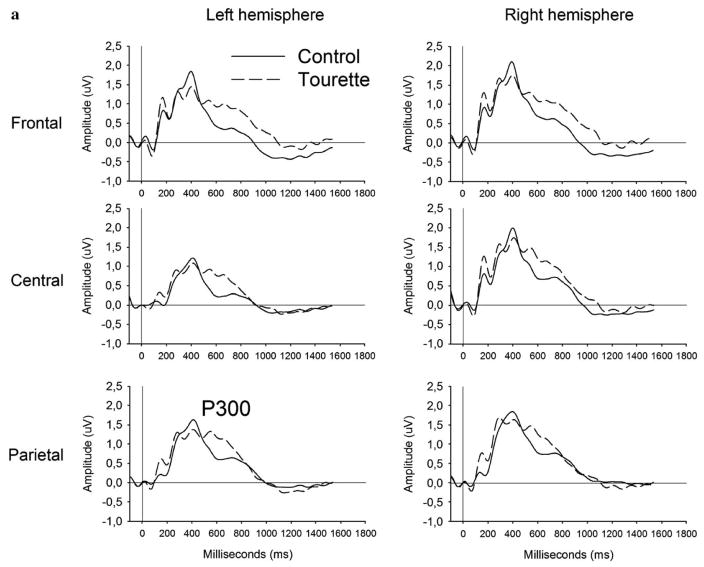
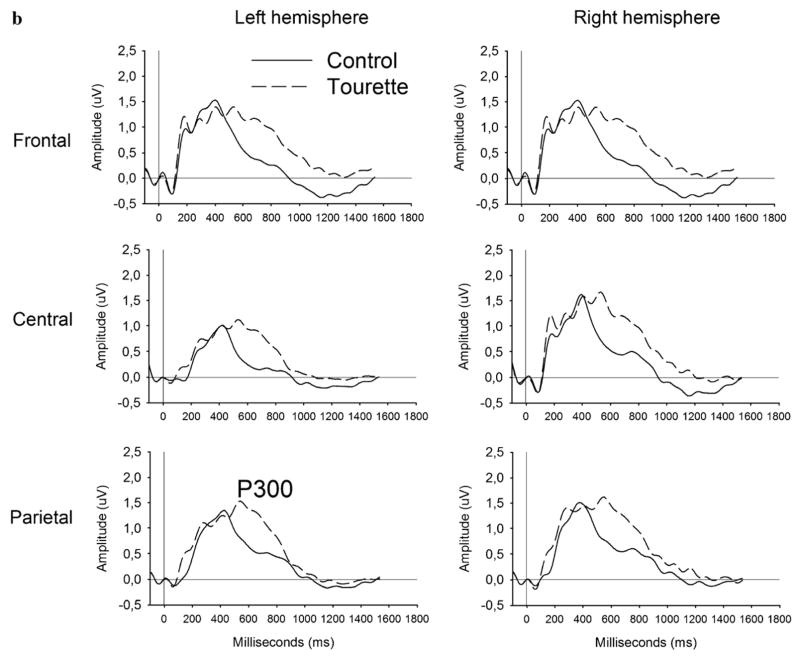
Fig. 3.
Comparison of the stimulus-locked ERP between the GTS (dotted curve) and the control (solid curve) group in response to the compatible (panel a), incompatible (panel b) in the stimulus–response compatibility task. The P300 peak latency in the compatible and no-go trials was equivalent across groups, while the incompatible trials elicited delayed peak latency in the GTS (dotted curve) compared to the control (solid curve) group.


