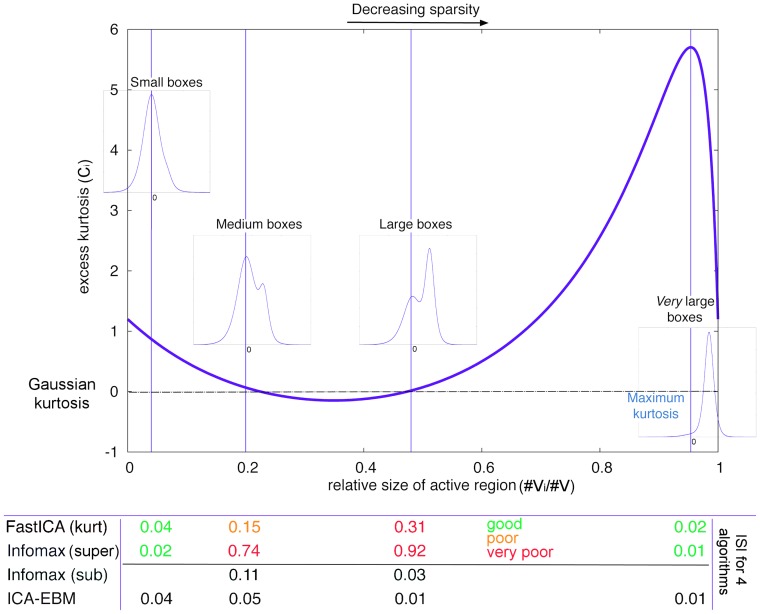
Figure 1. The excess kurtosis of a source  as a function of the relative size of the active region.
A Gaussian has zero excess kurtosis. Here  as in Example 2 of the original paper [8]. The four vertical lines at correspond to the relative sizes of the small box, the medium box, the large box, and a very large box corresponding to the maximal kurtosis case. Note that the medium and large box experiments have near zero excess kurtosis, i.e., kurtosis value matching that of a Gaussian. In addition, the pdfs of these sources are bimodal (see inset figures), ensuring that ICA algorithms designed for unimodal super-Gaussian distributions such as Infomax and FastICA with standard parameter settings, will likely fail. At the bottom of the figure are the ISI values (see Equation (2)) for the various algorithms at those four points (see Table 1 for full list). Also note the best separation performance of Infomax and FastICA for the maximum kurtosis case, which corresponds to almost the lowest level of sparsity.

